Nonimmigrants vs Lebanese In Labor Force | Age 35-44
COMPARE
Nonimmigrants
Lebanese
In Labor Force | Age 35-44
In Labor Force | Age 35-44 Comparison
Nonimmigrants
Lebanese
83.2%
IN LABOR FORCE | AGE 35-44
0.0/ 100
METRIC RATING
274th/ 347
METRIC RANK
83.6%
IN LABOR FORCE | AGE 35-44
0.4/ 100
METRIC RATING
253rd/ 347
METRIC RANK
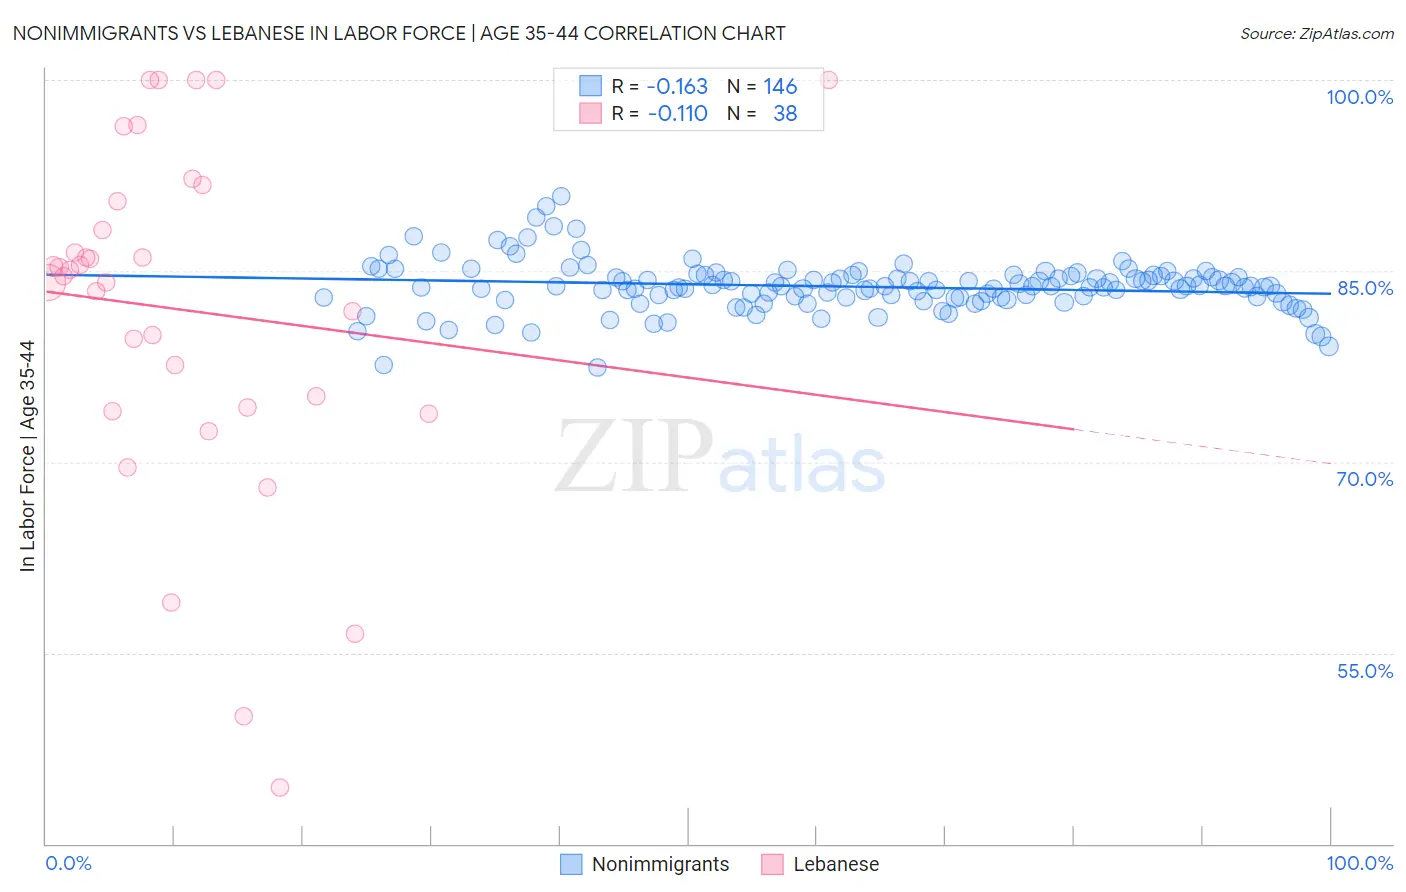
Nonimmigrants vs Lebanese In Labor Force | Age 35-44 Correlation Chart
The statistical analysis conducted on geographies consisting of 584,065,526 people shows a poor negative correlation between the proportion of Nonimmigrants and labor force participation rate among population between the ages 35 and 44 in the United States with a correlation coefficient (R) of -0.163 and weighted average of 83.2%. Similarly, the statistical analysis conducted on geographies consisting of 401,370,132 people shows a poor negative correlation between the proportion of Lebanese and labor force participation rate among population between the ages 35 and 44 in the United States with a correlation coefficient (R) of -0.110 and weighted average of 83.6%, a difference of 0.49%.
In Labor Force | Age 35-44 Correlation Summary
| Measurement | Nonimmigrants | Lebanese |
| Minimum | 77.4% | 44.4% |
| Maximum | 90.8% | 100.0% |
| Range | 13.4% | 55.6% |
| Mean | 83.8% | 81.9% |
| Median | 83.8% | 84.8% |
| Interquartile 25% (IQ1) | 82.9% | 74.3% |
| Interquartile 75% (IQ3) | 84.6% | 90.5% |
| Interquartile Range (IQR) | 1.7% | 16.2% |
| Standard Deviation (Sample) | 2.0% | 13.6% |
| Standard Deviation (Population) | 2.0% | 13.4% |
Similar Demographics by In Labor Force | Age 35-44
Demographics Similar to Nonimmigrants by In Labor Force | Age 35-44
In terms of in labor force | age 35-44, the demographic groups most similar to Nonimmigrants are Immigrants from Fiji (83.2%, a difference of 0.020%), Spanish (83.2%, a difference of 0.020%), Hawaiian (83.2%, a difference of 0.020%), Delaware (83.2%, a difference of 0.030%), and Samoan (83.2%, a difference of 0.030%).
| Demographics | Rating | Rank | In Labor Force | Age 35-44 |
| Guamanians/Chamorros | 0.1 /100 | #267 | Tragic 83.4% |
| Hondurans | 0.1 /100 | #268 | Tragic 83.4% |
| Immigrants | Grenada | 0.1 /100 | #269 | Tragic 83.3% |
| Immigrants | Honduras | 0.0 /100 | #270 | Tragic 83.3% |
| French American Indians | 0.0 /100 | #271 | Tragic 83.2% |
| Immigrants | Fiji | 0.0 /100 | #272 | Tragic 83.2% |
| Spanish | 0.0 /100 | #273 | Tragic 83.2% |
| Immigrants | Nonimmigrants | 0.0 /100 | #274 | Tragic 83.2% |
| Hawaiians | 0.0 /100 | #275 | Tragic 83.2% |
| Delaware | 0.0 /100 | #276 | Tragic 83.2% |
| Samoans | 0.0 /100 | #277 | Tragic 83.2% |
| Belizeans | 0.0 /100 | #278 | Tragic 83.1% |
| Immigrants | Micronesia | 0.0 /100 | #279 | Tragic 83.1% |
| Dominicans | 0.0 /100 | #280 | Tragic 83.1% |
| Guatemalans | 0.0 /100 | #281 | Tragic 83.0% |
Demographics Similar to Lebanese by In Labor Force | Age 35-44
In terms of in labor force | age 35-44, the demographic groups most similar to Lebanese are Salvadoran (83.6%, a difference of 0.0%), Immigrants from Guyana (83.6%, a difference of 0.0%), Tongan (83.6%, a difference of 0.010%), White/Caucasian (83.6%, a difference of 0.020%), and Immigrants from the Azores (83.6%, a difference of 0.040%).
| Demographics | Rating | Rank | In Labor Force | Age 35-44 |
| Immigrants | Immigrants | 1.0 /100 | #246 | Tragic 83.7% |
| Immigrants | Armenia | 0.9 /100 | #247 | Tragic 83.7% |
| Indonesians | 0.8 /100 | #248 | Tragic 83.7% |
| Immigrants | St. Vincent and the Grenadines | 0.7 /100 | #249 | Tragic 83.7% |
| Whites/Caucasians | 0.5 /100 | #250 | Tragic 83.6% |
| Salvadorans | 0.4 /100 | #251 | Tragic 83.6% |
| Immigrants | Guyana | 0.4 /100 | #252 | Tragic 83.6% |
| Lebanese | 0.4 /100 | #253 | Tragic 83.6% |
| Tongans | 0.4 /100 | #254 | Tragic 83.6% |
| Immigrants | Azores | 0.3 /100 | #255 | Tragic 83.6% |
| Japanese | 0.3 /100 | #256 | Tragic 83.6% |
| Basques | 0.3 /100 | #257 | Tragic 83.6% |
| Tsimshian | 0.2 /100 | #258 | Tragic 83.5% |
| Immigrants | El Salvador | 0.2 /100 | #259 | Tragic 83.5% |
| Vietnamese | 0.2 /100 | #260 | Tragic 83.5% |