Nonimmigrants vs Macedonian Ambulatory Disability
COMPARE
Nonimmigrants
Macedonian
Ambulatory Disability
Ambulatory Disability Comparison
Nonimmigrants
Macedonians
6.9%
AMBULATORY DISABILITY
0.0/ 100
METRIC RATING
288th/ 347
METRIC RANK
6.0%
AMBULATORY DISABILITY
82.8/ 100
METRIC RATING
144th/ 347
METRIC RANK
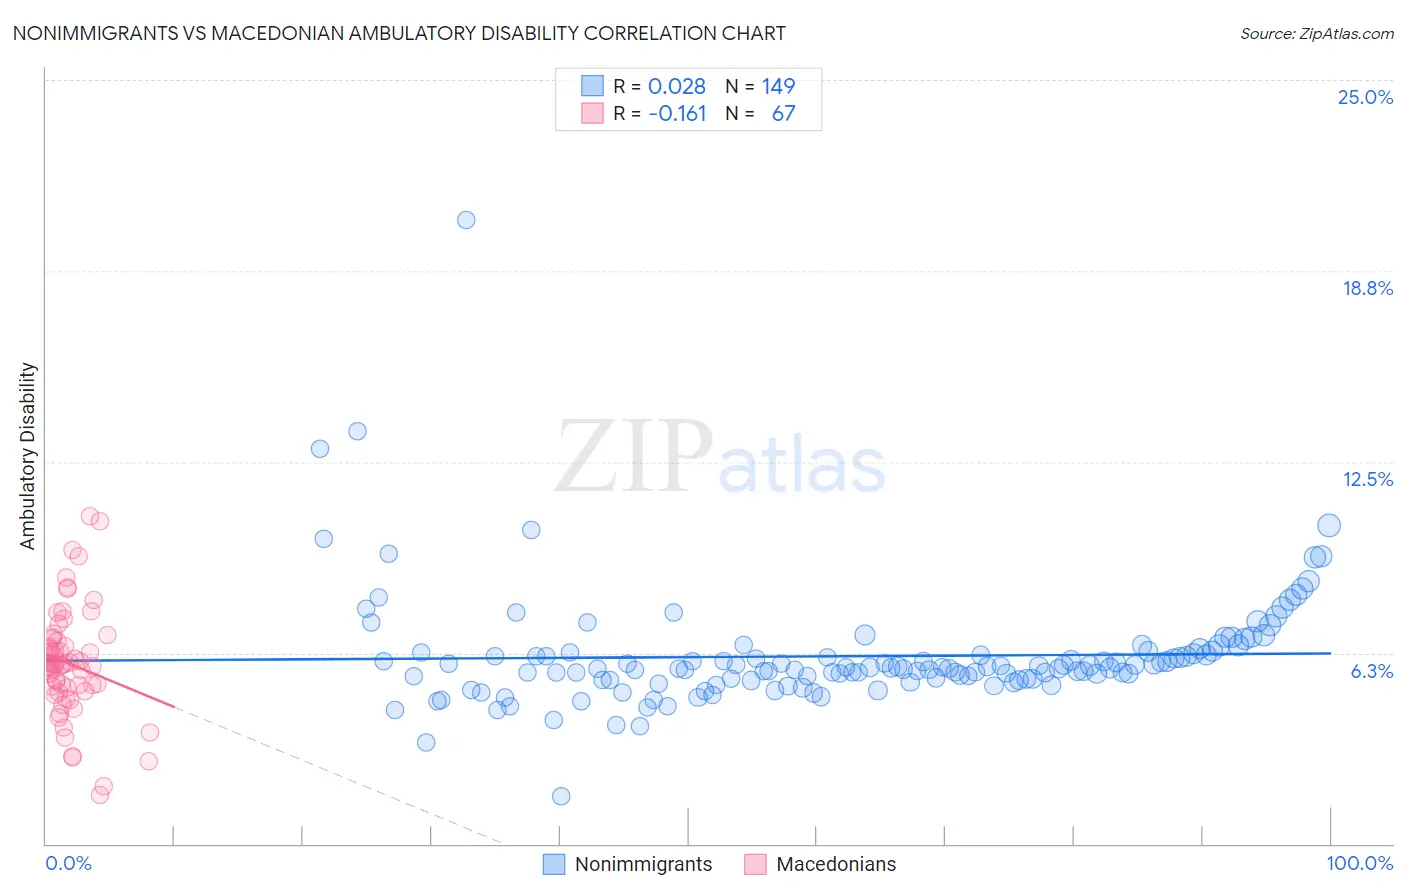
Nonimmigrants vs Macedonian Ambulatory Disability Correlation Chart
The statistical analysis conducted on geographies consisting of 584,325,810 people shows no correlation between the proportion of Nonimmigrants and percentage of population with ambulatory disability in the United States with a correlation coefficient (R) of 0.028 and weighted average of 6.9%. Similarly, the statistical analysis conducted on geographies consisting of 132,658,712 people shows a poor negative correlation between the proportion of Macedonians and percentage of population with ambulatory disability in the United States with a correlation coefficient (R) of -0.161 and weighted average of 6.0%, a difference of 14.4%.
Ambulatory Disability Correlation Summary
| Measurement | Nonimmigrants | Macedonian |
| Minimum | 1.6% | 1.6% |
| Maximum | 20.4% | 10.7% |
| Range | 18.8% | 9.1% |
| Mean | 6.1% | 5.9% |
| Median | 5.8% | 5.9% |
| Interquartile 25% (IQ1) | 5.4% | 5.0% |
| Interquartile 75% (IQ3) | 6.2% | 6.7% |
| Interquartile Range (IQR) | 0.88% | 1.7% |
| Standard Deviation (Sample) | 1.9% | 1.8% |
| Standard Deviation (Population) | 1.9% | 1.8% |
Similar Demographics by Ambulatory Disability
Demographics Similar to Nonimmigrants by Ambulatory Disability
In terms of ambulatory disability, the demographic groups most similar to Nonimmigrants are Immigrants from Dominica (6.9%, a difference of 0.14%), Scotch-Irish (6.9%, a difference of 0.17%), U.S. Virgin Islander (6.8%, a difference of 0.27%), West Indian (6.9%, a difference of 0.27%), and Cheyenne (6.9%, a difference of 0.33%).
| Demographics | Rating | Rank | Ambulatory Disability |
| Yaqui | 0.0 /100 | #281 | Tragic 6.8% |
| Barbadians | 0.0 /100 | #282 | Tragic 6.8% |
| Immigrants | Barbados | 0.0 /100 | #283 | Tragic 6.8% |
| Immigrants | Jamaica | 0.0 /100 | #284 | Tragic 6.8% |
| Fijians | 0.0 /100 | #285 | Tragic 6.8% |
| Yakama | 0.0 /100 | #286 | Tragic 6.8% |
| U.S. Virgin Islanders | 0.0 /100 | #287 | Tragic 6.8% |
| Immigrants | Nonimmigrants | 0.0 /100 | #288 | Tragic 6.9% |
| Immigrants | Dominica | 0.0 /100 | #289 | Tragic 6.9% |
| Scotch-Irish | 0.0 /100 | #290 | Tragic 6.9% |
| West Indians | 0.0 /100 | #291 | Tragic 6.9% |
| Cheyenne | 0.0 /100 | #292 | Tragic 6.9% |
| Immigrants | St. Vincent and the Grenadines | 0.0 /100 | #293 | Tragic 6.9% |
| Cape Verdeans | 0.0 /100 | #294 | Tragic 6.9% |
| Crow | 0.0 /100 | #295 | Tragic 6.9% |
Demographics Similar to Macedonians by Ambulatory Disability
In terms of ambulatory disability, the demographic groups most similar to Macedonians are Romanian (6.0%, a difference of 0.010%), Immigrants from Philippines (6.0%, a difference of 0.020%), Swedish (6.0%, a difference of 0.030%), Pakistani (6.0%, a difference of 0.030%), and Immigrants from Greece (6.0%, a difference of 0.030%).
| Demographics | Rating | Rank | Ambulatory Disability |
| Immigrants | Syria | 84.1 /100 | #137 | Excellent 6.0% |
| Immigrants | Hungary | 83.9 /100 | #138 | Excellent 6.0% |
| Immigrants | Zaire | 83.6 /100 | #139 | Excellent 6.0% |
| Czechs | 83.3 /100 | #140 | Excellent 6.0% |
| Swedes | 83.1 /100 | #141 | Excellent 6.0% |
| Immigrants | Philippines | 83.0 /100 | #142 | Excellent 6.0% |
| Romanians | 82.9 /100 | #143 | Excellent 6.0% |
| Macedonians | 82.8 /100 | #144 | Excellent 6.0% |
| Pakistanis | 82.5 /100 | #145 | Excellent 6.0% |
| Immigrants | Greece | 82.5 /100 | #146 | Excellent 6.0% |
| Immigrants | Moldova | 82.4 /100 | #147 | Excellent 6.0% |
| Immigrants | Eastern Europe | 82.0 /100 | #148 | Excellent 6.0% |
| Lithuanians | 81.9 /100 | #149 | Excellent 6.0% |
| Maltese | 81.6 /100 | #150 | Excellent 6.0% |
| Greeks | 79.6 /100 | #151 | Good 6.0% |