Nonimmigrants vs Serbian Ambulatory Disability
COMPARE
Nonimmigrants
Serbian
Ambulatory Disability
Ambulatory Disability Comparison
Nonimmigrants
Serbians
6.9%
AMBULATORY DISABILITY
0.0/ 100
METRIC RATING
288th/ 347
METRIC RANK
6.1%
AMBULATORY DISABILITY
42.8/ 100
METRIC RATING
182nd/ 347
METRIC RANK
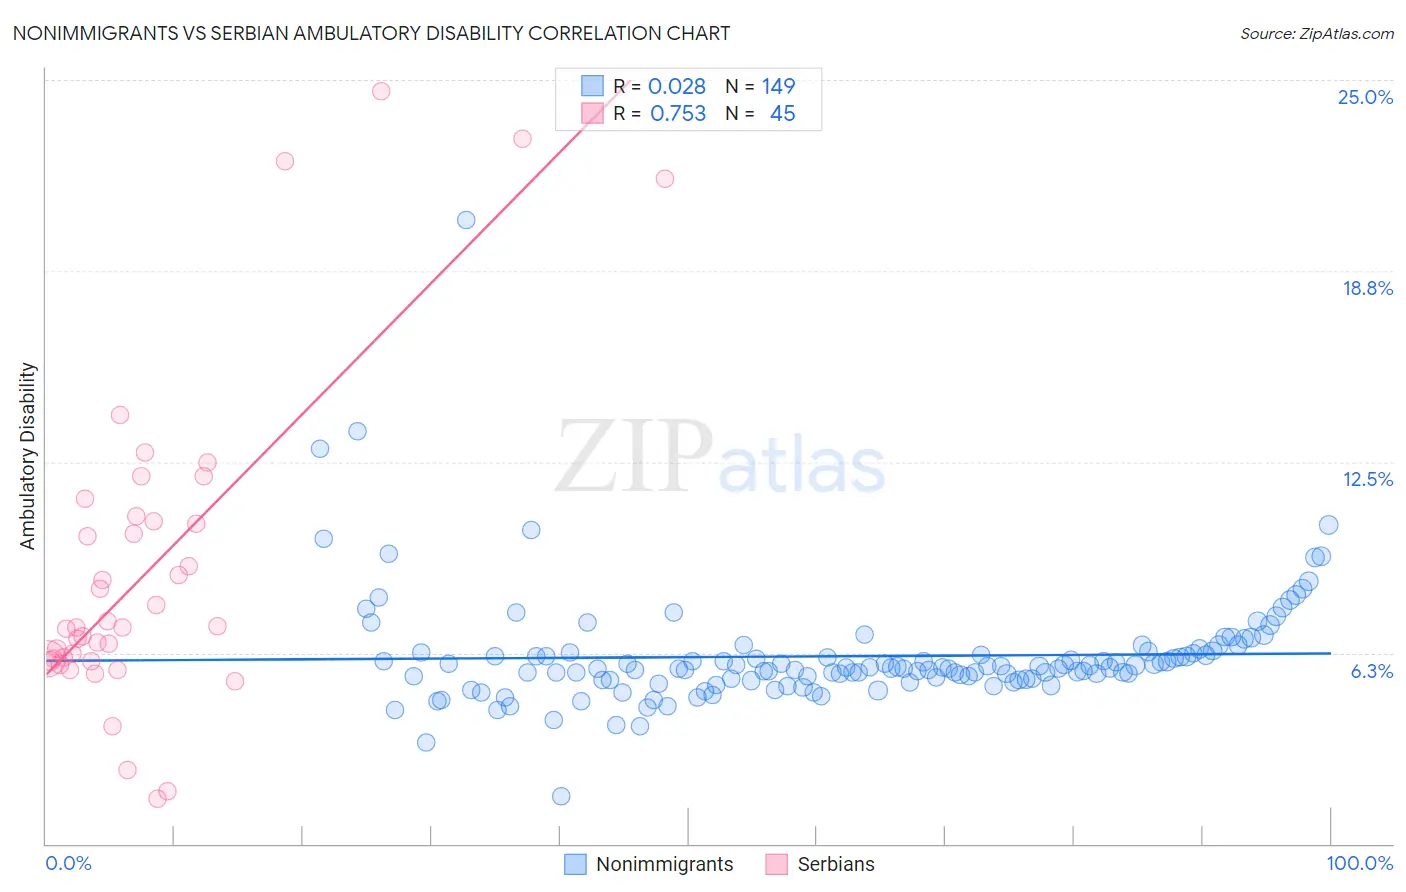
Nonimmigrants vs Serbian Ambulatory Disability Correlation Chart
The statistical analysis conducted on geographies consisting of 584,325,810 people shows no correlation between the proportion of Nonimmigrants and percentage of population with ambulatory disability in the United States with a correlation coefficient (R) of 0.028 and weighted average of 6.9%. Similarly, the statistical analysis conducted on geographies consisting of 267,596,356 people shows a strong positive correlation between the proportion of Serbians and percentage of population with ambulatory disability in the United States with a correlation coefficient (R) of 0.753 and weighted average of 6.1%, a difference of 11.6%.
Ambulatory Disability Correlation Summary
| Measurement | Nonimmigrants | Serbian |
| Minimum | 1.6% | 1.5% |
| Maximum | 20.4% | 24.6% |
| Range | 18.8% | 23.2% |
| Mean | 6.1% | 9.0% |
| Median | 5.8% | 7.1% |
| Interquartile 25% (IQ1) | 5.4% | 6.0% |
| Interquartile 75% (IQ3) | 6.2% | 10.6% |
| Interquartile Range (IQR) | 0.88% | 4.6% |
| Standard Deviation (Sample) | 1.9% | 5.2% |
| Standard Deviation (Population) | 1.9% | 5.2% |
Similar Demographics by Ambulatory Disability
Demographics Similar to Nonimmigrants by Ambulatory Disability
In terms of ambulatory disability, the demographic groups most similar to Nonimmigrants are Immigrants from Dominica (6.9%, a difference of 0.14%), Scotch-Irish (6.9%, a difference of 0.17%), U.S. Virgin Islander (6.8%, a difference of 0.27%), West Indian (6.9%, a difference of 0.27%), and Cheyenne (6.9%, a difference of 0.33%).
| Demographics | Rating | Rank | Ambulatory Disability |
| Yaqui | 0.0 /100 | #281 | Tragic 6.8% |
| Barbadians | 0.0 /100 | #282 | Tragic 6.8% |
| Immigrants | Barbados | 0.0 /100 | #283 | Tragic 6.8% |
| Immigrants | Jamaica | 0.0 /100 | #284 | Tragic 6.8% |
| Fijians | 0.0 /100 | #285 | Tragic 6.8% |
| Yakama | 0.0 /100 | #286 | Tragic 6.8% |
| U.S. Virgin Islanders | 0.0 /100 | #287 | Tragic 6.8% |
| Immigrants | Nonimmigrants | 0.0 /100 | #288 | Tragic 6.9% |
| Immigrants | Dominica | 0.0 /100 | #289 | Tragic 6.9% |
| Scotch-Irish | 0.0 /100 | #290 | Tragic 6.9% |
| West Indians | 0.0 /100 | #291 | Tragic 6.9% |
| Cheyenne | 0.0 /100 | #292 | Tragic 6.9% |
| Immigrants | St. Vincent and the Grenadines | 0.0 /100 | #293 | Tragic 6.9% |
| Cape Verdeans | 0.0 /100 | #294 | Tragic 6.9% |
| Crow | 0.0 /100 | #295 | Tragic 6.9% |
Demographics Similar to Serbians by Ambulatory Disability
In terms of ambulatory disability, the demographic groups most similar to Serbians are Swiss (6.1%, a difference of 0.010%), Immigrants from Thailand (6.1%, a difference of 0.030%), Immigrants from Nicaragua (6.1%, a difference of 0.060%), Austrian (6.1%, a difference of 0.070%), and Scandinavian (6.1%, a difference of 0.090%).
| Demographics | Rating | Rank | Ambulatory Disability |
| Vietnamese | 47.2 /100 | #175 | Average 6.1% |
| Immigrants | North America | 45.6 /100 | #176 | Average 6.1% |
| Immigrants | England | 45.4 /100 | #177 | Average 6.1% |
| Scandinavians | 44.5 /100 | #178 | Average 6.1% |
| Austrians | 44.1 /100 | #179 | Average 6.1% |
| Immigrants | Nicaragua | 43.9 /100 | #180 | Average 6.1% |
| Swiss | 43.1 /100 | #181 | Average 6.1% |
| Serbians | 42.8 /100 | #182 | Average 6.1% |
| Immigrants | Thailand | 42.2 /100 | #183 | Average 6.1% |
| Immigrants | Ghana | 41.2 /100 | #184 | Average 6.1% |
| Immigrants | Bosnia and Herzegovina | 37.2 /100 | #185 | Fair 6.2% |
| Europeans | 36.2 /100 | #186 | Fair 6.2% |
| Carpatho Rusyns | 35.3 /100 | #187 | Fair 6.2% |
| British | 34.3 /100 | #188 | Fair 6.2% |
| Ukrainians | 34.0 /100 | #189 | Fair 6.2% |