Nigerian vs Thai Disability Age Under 5
COMPARE
Nigerian
Thai
Disability Age Under 5
Disability Age Under 5 Comparison
Nigerians
Thais
1.3%
DISABILITY AGE UNDER 5
21.2/ 100
METRIC RATING
207th/ 347
METRIC RANK
1.1%
DISABILITY AGE UNDER 5
99.8/ 100
METRIC RATING
41st/ 347
METRIC RANK
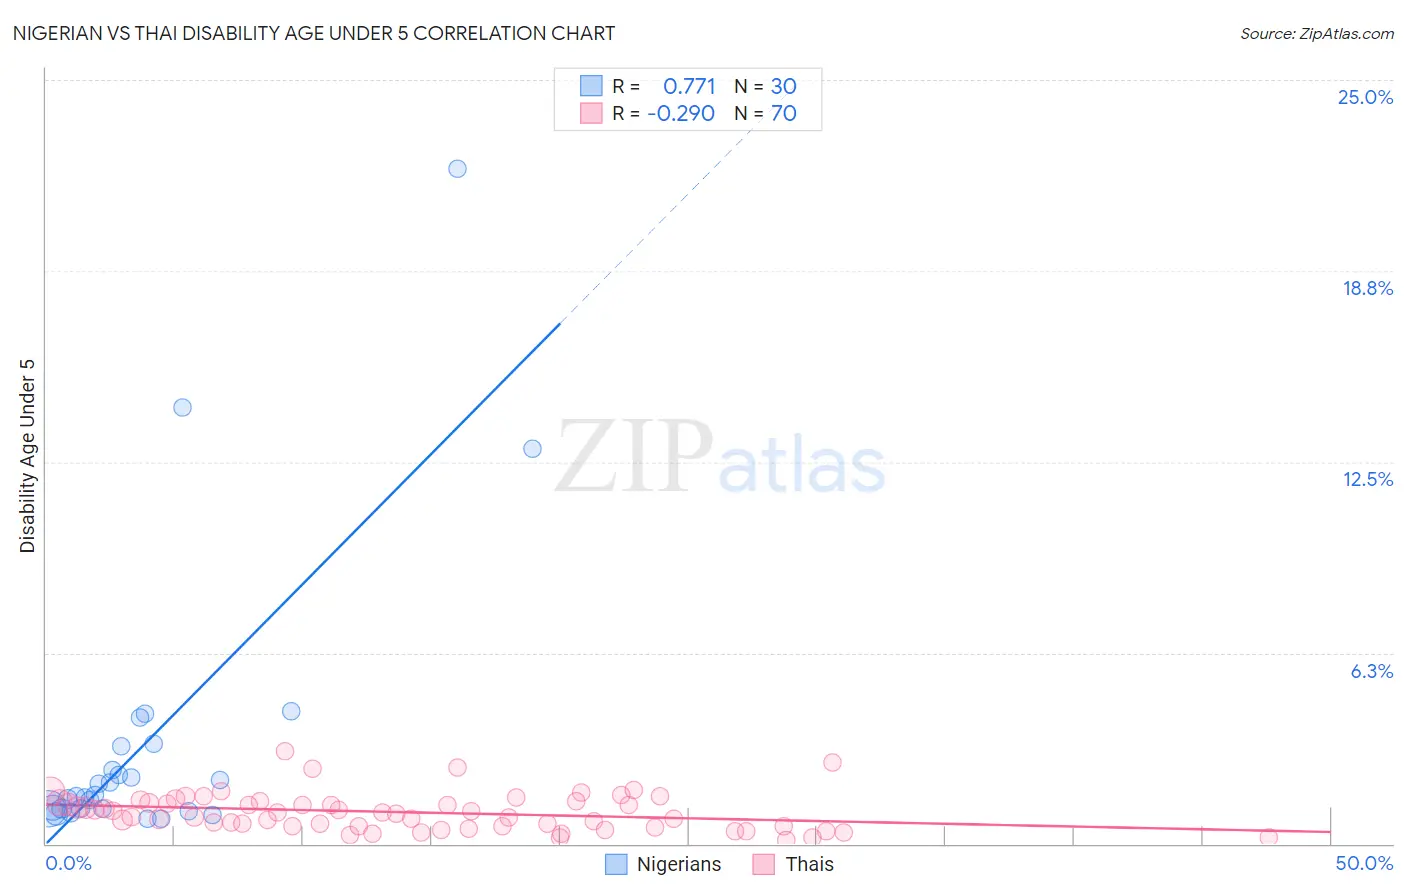
Nigerian vs Thai Disability Age Under 5 Correlation Chart
The statistical analysis conducted on geographies consisting of 194,464,110 people shows a strong positive correlation between the proportion of Nigerians and percentage of population with a disability under the age of 5 in the United States with a correlation coefficient (R) of 0.771 and weighted average of 1.3%. Similarly, the statistical analysis conducted on geographies consisting of 242,704,166 people shows a weak negative correlation between the proportion of Thais and percentage of population with a disability under the age of 5 in the United States with a correlation coefficient (R) of -0.290 and weighted average of 1.1%, a difference of 20.4%.
Disability Age Under 5 Correlation Summary
| Measurement | Nigerian | Thai |
| Minimum | 0.82% | 0.14% |
| Maximum | 22.1% | 3.0% |
| Range | 21.3% | 2.9% |
| Mean | 3.3% | 1.0% |
| Median | 1.6% | 1.0% |
| Interquartile 25% (IQ1) | 1.2% | 0.58% |
| Interquartile 75% (IQ3) | 3.2% | 1.3% |
| Interquartile Range (IQR) | 2.0% | 0.76% |
| Standard Deviation (Sample) | 4.7% | 0.60% |
| Standard Deviation (Population) | 4.7% | 0.60% |
Similar Demographics by Disability Age Under 5
Demographics Similar to Nigerians by Disability Age Under 5
In terms of disability age under 5, the demographic groups most similar to Nigerians are Mexican (1.3%, a difference of 0.060%), Immigrants from Poland (1.3%, a difference of 0.15%), Romanian (1.3%, a difference of 0.17%), Bulgarian (1.3%, a difference of 0.23%), and Pakistani (1.3%, a difference of 0.24%).
| Demographics | Rating | Rank | Disability Age Under 5 |
| Immigrants | Lithuania | 27.2 /100 | #200 | Fair 1.3% |
| Immigrants | Italy | 25.4 /100 | #201 | Fair 1.3% |
| Arapaho | 24.1 /100 | #202 | Fair 1.3% |
| Liberians | 24.0 /100 | #203 | Fair 1.3% |
| Immigrants | Europe | 23.6 /100 | #204 | Fair 1.3% |
| Romanians | 22.5 /100 | #205 | Fair 1.3% |
| Immigrants | Poland | 22.4 /100 | #206 | Fair 1.3% |
| Nigerians | 21.2 /100 | #207 | Fair 1.3% |
| Mexicans | 20.8 /100 | #208 | Fair 1.3% |
| Bulgarians | 19.5 /100 | #209 | Poor 1.3% |
| Pakistanis | 19.4 /100 | #210 | Poor 1.3% |
| Immigrants | Greece | 19.1 /100 | #211 | Poor 1.3% |
| Chileans | 18.8 /100 | #212 | Poor 1.3% |
| Immigrants | Sudan | 18.7 /100 | #213 | Poor 1.3% |
| Immigrants | Chile | 17.2 /100 | #214 | Poor 1.3% |
Demographics Similar to Thais by Disability Age Under 5
In terms of disability age under 5, the demographic groups most similar to Thais are Immigrants from Bulgaria (1.1%, a difference of 0.10%), Pima (1.1%, a difference of 0.11%), Immigrants from Asia (1.1%, a difference of 0.21%), Immigrants from Albania (1.1%, a difference of 0.41%), and Immigrants from Turkey (1.1%, a difference of 0.43%).
| Demographics | Rating | Rank | Disability Age Under 5 |
| Immigrants | Ukraine | 99.9 /100 | #34 | Exceptional 1.0% |
| Barbadians | 99.9 /100 | #35 | Exceptional 1.0% |
| Immigrants | Nepal | 99.9 /100 | #36 | Exceptional 1.0% |
| Immigrants | India | 99.9 /100 | #37 | Exceptional 1.0% |
| Immigrants | Guyana | 99.9 /100 | #38 | Exceptional 1.0% |
| Filipinos | 99.9 /100 | #39 | Exceptional 1.1% |
| Immigrants | Albania | 99.9 /100 | #40 | Exceptional 1.1% |
| Thais | 99.8 /100 | #41 | Exceptional 1.1% |
| Immigrants | Bulgaria | 99.8 /100 | #42 | Exceptional 1.1% |
| Pima | 99.8 /100 | #43 | Exceptional 1.1% |
| Immigrants | Asia | 99.8 /100 | #44 | Exceptional 1.1% |
| Immigrants | Turkey | 99.8 /100 | #45 | Exceptional 1.1% |
| Immigrants | Congo | 99.8 /100 | #46 | Exceptional 1.1% |
| Immigrants | Sweden | 99.8 /100 | #47 | Exceptional 1.1% |
| Immigrants | Singapore | 99.7 /100 | #48 | Exceptional 1.1% |