Kenyan vs Thai Disability Age Under 5
COMPARE
Kenyan
Thai
Disability Age Under 5
Disability Age Under 5 Comparison
Kenyans
Thais
1.2%
DISABILITY AGE UNDER 5
75.9/ 100
METRIC RATING
149th/ 347
METRIC RANK
1.1%
DISABILITY AGE UNDER 5
99.8/ 100
METRIC RATING
41st/ 347
METRIC RANK
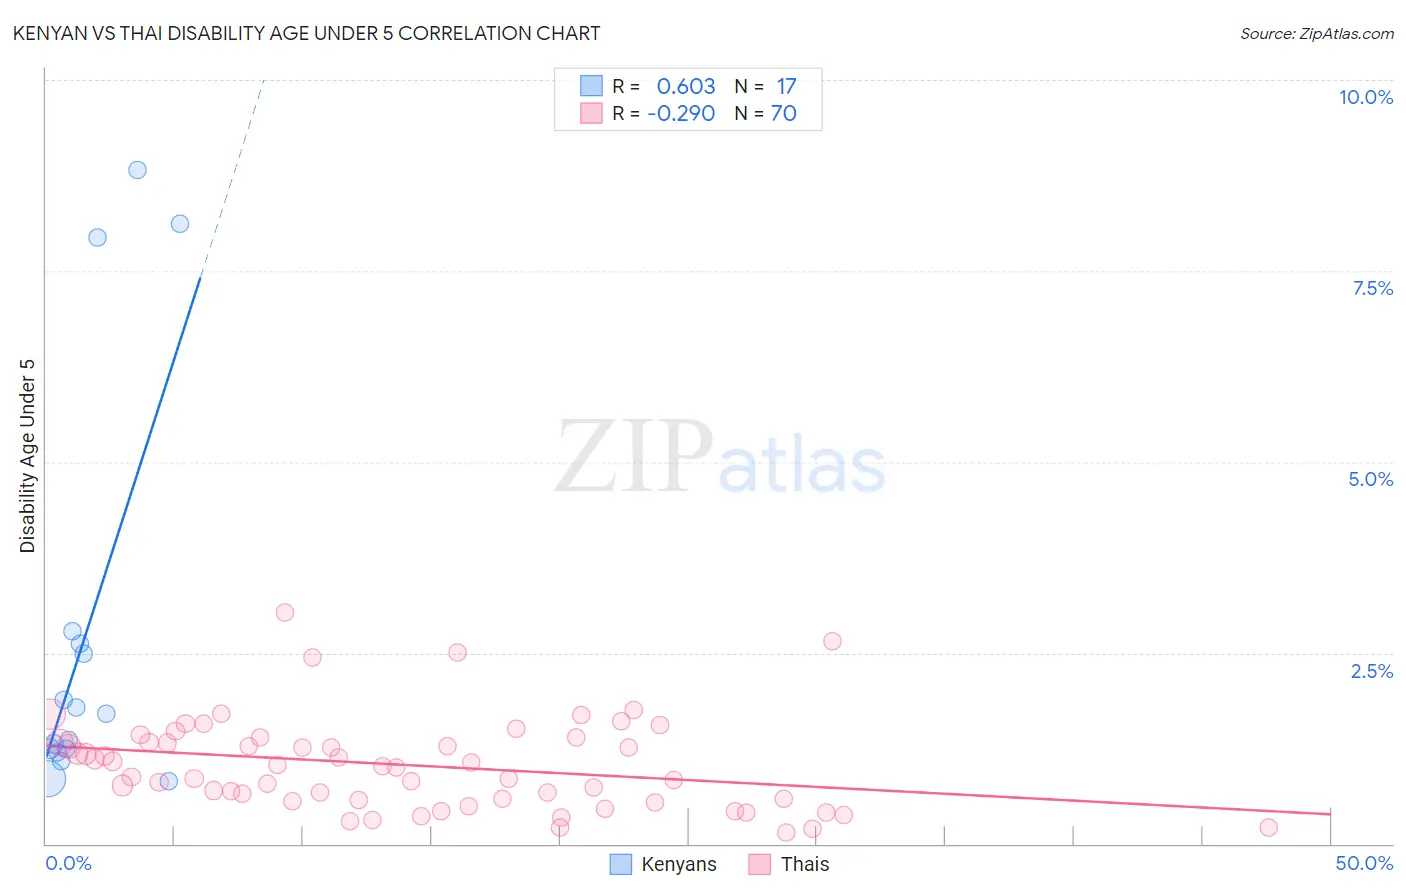
Kenyan vs Thai Disability Age Under 5 Correlation Chart
The statistical analysis conducted on geographies consisting of 118,614,318 people shows a significant positive correlation between the proportion of Kenyans and percentage of population with a disability under the age of 5 in the United States with a correlation coefficient (R) of 0.603 and weighted average of 1.2%. Similarly, the statistical analysis conducted on geographies consisting of 242,704,166 people shows a weak negative correlation between the proportion of Thais and percentage of population with a disability under the age of 5 in the United States with a correlation coefficient (R) of -0.290 and weighted average of 1.1%, a difference of 13.9%.
Disability Age Under 5 Correlation Summary
| Measurement | Kenyan | Thai |
| Minimum | 0.82% | 0.14% |
| Maximum | 8.8% | 3.0% |
| Range | 8.0% | 2.9% |
| Mean | 2.8% | 1.0% |
| Median | 1.7% | 1.0% |
| Interquartile 25% (IQ1) | 1.2% | 0.58% |
| Interquartile 75% (IQ3) | 2.7% | 1.3% |
| Interquartile Range (IQR) | 1.5% | 0.76% |
| Standard Deviation (Sample) | 2.7% | 0.60% |
| Standard Deviation (Population) | 2.6% | 0.60% |
Similar Demographics by Disability Age Under 5
Demographics Similar to Kenyans by Disability Age Under 5
In terms of disability age under 5, the demographic groups most similar to Kenyans are South American (1.2%, a difference of 0.040%), Ghanaian (1.2%, a difference of 0.050%), Icelander (1.2%, a difference of 0.060%), Yaqui (1.2%, a difference of 0.14%), and Samoan (1.2%, a difference of 0.23%).
| Demographics | Rating | Rank | Disability Age Under 5 |
| Immigrants | Colombia | 79.3 /100 | #142 | Good 1.2% |
| Alsatians | 79.3 /100 | #143 | Good 1.2% |
| Immigrants | Middle Africa | 79.3 /100 | #144 | Good 1.2% |
| Immigrants | Zimbabwe | 77.9 /100 | #145 | Good 1.2% |
| Samoans | 77.7 /100 | #146 | Good 1.2% |
| Icelanders | 76.3 /100 | #147 | Good 1.2% |
| Ghanaians | 76.3 /100 | #148 | Good 1.2% |
| Kenyans | 75.9 /100 | #149 | Good 1.2% |
| South Americans | 75.6 /100 | #150 | Good 1.2% |
| Yaqui | 74.8 /100 | #151 | Good 1.2% |
| Hondurans | 72.5 /100 | #152 | Good 1.2% |
| Immigrants | Thailand | 69.4 /100 | #153 | Good 1.2% |
| Uruguayans | 68.8 /100 | #154 | Good 1.2% |
| Immigrants | Ghana | 68.7 /100 | #155 | Good 1.2% |
| Hawaiians | 68.5 /100 | #156 | Good 1.2% |
Demographics Similar to Thais by Disability Age Under 5
In terms of disability age under 5, the demographic groups most similar to Thais are Immigrants from Bulgaria (1.1%, a difference of 0.10%), Pima (1.1%, a difference of 0.11%), Immigrants from Asia (1.1%, a difference of 0.21%), Immigrants from Albania (1.1%, a difference of 0.41%), and Immigrants from Turkey (1.1%, a difference of 0.43%).
| Demographics | Rating | Rank | Disability Age Under 5 |
| Immigrants | Ukraine | 99.9 /100 | #34 | Exceptional 1.0% |
| Barbadians | 99.9 /100 | #35 | Exceptional 1.0% |
| Immigrants | Nepal | 99.9 /100 | #36 | Exceptional 1.0% |
| Immigrants | India | 99.9 /100 | #37 | Exceptional 1.0% |
| Immigrants | Guyana | 99.9 /100 | #38 | Exceptional 1.0% |
| Filipinos | 99.9 /100 | #39 | Exceptional 1.1% |
| Immigrants | Albania | 99.9 /100 | #40 | Exceptional 1.1% |
| Thais | 99.8 /100 | #41 | Exceptional 1.1% |
| Immigrants | Bulgaria | 99.8 /100 | #42 | Exceptional 1.1% |
| Pima | 99.8 /100 | #43 | Exceptional 1.1% |
| Immigrants | Asia | 99.8 /100 | #44 | Exceptional 1.1% |
| Immigrants | Turkey | 99.8 /100 | #45 | Exceptional 1.1% |
| Immigrants | Congo | 99.8 /100 | #46 | Exceptional 1.1% |
| Immigrants | Sweden | 99.8 /100 | #47 | Exceptional 1.1% |
| Immigrants | Singapore | 99.7 /100 | #48 | Exceptional 1.1% |