Immigrants from Yemen vs Thai Disability Age Under 5
COMPARE
Immigrants from Yemen
Thai
Disability Age Under 5
Disability Age Under 5 Comparison
Immigrants from Yemen
Thais
0.91%
DISABILITY AGE UNDER 5
100.0/ 100
METRIC RATING
8th/ 347
METRIC RANK
1.1%
DISABILITY AGE UNDER 5
99.8/ 100
METRIC RATING
41st/ 347
METRIC RANK
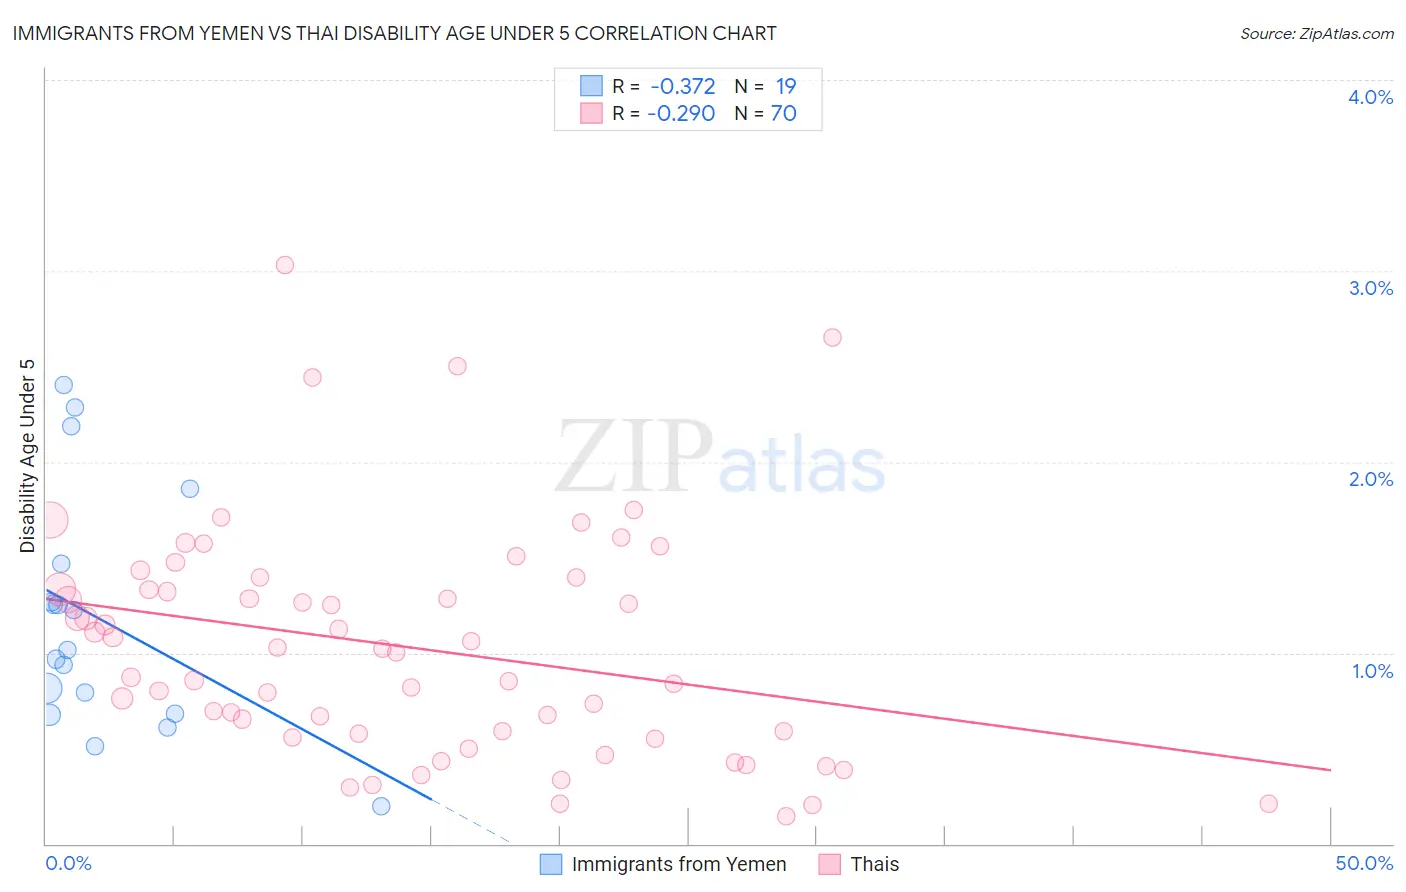
Immigrants from Yemen vs Thai Disability Age Under 5 Correlation Chart
The statistical analysis conducted on geographies consisting of 65,167,060 people shows a mild negative correlation between the proportion of Immigrants from Yemen and percentage of population with a disability under the age of 5 in the United States with a correlation coefficient (R) of -0.372 and weighted average of 0.91%. Similarly, the statistical analysis conducted on geographies consisting of 242,704,166 people shows a weak negative correlation between the proportion of Thais and percentage of population with a disability under the age of 5 in the United States with a correlation coefficient (R) of -0.290 and weighted average of 1.1%, a difference of 16.8%.
Disability Age Under 5 Correlation Summary
| Measurement | Immigrants from Yemen | Thai |
| Minimum | 0.20% | 0.14% |
| Maximum | 2.4% | 3.0% |
| Range | 2.2% | 2.9% |
| Mean | 1.2% | 1.0% |
| Median | 1.0% | 1.0% |
| Interquartile 25% (IQ1) | 0.68% | 0.58% |
| Interquartile 75% (IQ3) | 1.5% | 1.3% |
| Interquartile Range (IQR) | 0.79% | 0.76% |
| Standard Deviation (Sample) | 0.62% | 0.60% |
| Standard Deviation (Population) | 0.61% | 0.60% |
Similar Demographics by Disability Age Under 5
Demographics Similar to Immigrants from Yemen by Disability Age Under 5
In terms of disability age under 5, the demographic groups most similar to Immigrants from Yemen are Immigrants from Afghanistan (0.91%, a difference of 0.13%), Immigrants from Fiji (0.92%, a difference of 1.1%), Marshallese (0.94%, a difference of 3.2%), Afghan (0.94%, a difference of 4.0%), and Immigrants from Grenada (0.94%, a difference of 4.0%).
| Demographics | Rating | Rank | Disability Age Under 5 |
| Immigrants | Armenia | 100.0 /100 | #1 | Exceptional 0.76% |
| Immigrants | St. Vincent and the Grenadines | 100.0 /100 | #2 | Exceptional 0.79% |
| Vietnamese | 100.0 /100 | #3 | Exceptional 0.81% |
| Immigrants | Uzbekistan | 100.0 /100 | #4 | Exceptional 0.85% |
| Immigrants | Bangladesh | 100.0 /100 | #5 | Exceptional 0.85% |
| Ute | 100.0 /100 | #6 | Exceptional 0.86% |
| Immigrants | Afghanistan | 100.0 /100 | #7 | Exceptional 0.91% |
| Immigrants | Yemen | 100.0 /100 | #8 | Exceptional 0.91% |
| Immigrants | Fiji | 100.0 /100 | #9 | Exceptional 0.92% |
| Marshallese | 100.0 /100 | #10 | Exceptional 0.94% |
| Afghans | 100.0 /100 | #11 | Exceptional 0.94% |
| Immigrants | Grenada | 100.0 /100 | #12 | Exceptional 0.94% |
| Soviet Union | 100.0 /100 | #13 | Exceptional 0.95% |
| Yuman | 100.0 /100 | #14 | Exceptional 0.95% |
| Immigrants | Hong Kong | 100.0 /100 | #15 | Exceptional 0.95% |
Demographics Similar to Thais by Disability Age Under 5
In terms of disability age under 5, the demographic groups most similar to Thais are Immigrants from Bulgaria (1.1%, a difference of 0.10%), Pima (1.1%, a difference of 0.11%), Immigrants from Asia (1.1%, a difference of 0.21%), Immigrants from Albania (1.1%, a difference of 0.41%), and Immigrants from Turkey (1.1%, a difference of 0.43%).
| Demographics | Rating | Rank | Disability Age Under 5 |
| Immigrants | Ukraine | 99.9 /100 | #34 | Exceptional 1.0% |
| Barbadians | 99.9 /100 | #35 | Exceptional 1.0% |
| Immigrants | Nepal | 99.9 /100 | #36 | Exceptional 1.0% |
| Immigrants | India | 99.9 /100 | #37 | Exceptional 1.0% |
| Immigrants | Guyana | 99.9 /100 | #38 | Exceptional 1.0% |
| Filipinos | 99.9 /100 | #39 | Exceptional 1.1% |
| Immigrants | Albania | 99.9 /100 | #40 | Exceptional 1.1% |
| Thais | 99.8 /100 | #41 | Exceptional 1.1% |
| Immigrants | Bulgaria | 99.8 /100 | #42 | Exceptional 1.1% |
| Pima | 99.8 /100 | #43 | Exceptional 1.1% |
| Immigrants | Asia | 99.8 /100 | #44 | Exceptional 1.1% |
| Immigrants | Turkey | 99.8 /100 | #45 | Exceptional 1.1% |
| Immigrants | Congo | 99.8 /100 | #46 | Exceptional 1.1% |
| Immigrants | Sweden | 99.8 /100 | #47 | Exceptional 1.1% |
| Immigrants | Singapore | 99.7 /100 | #48 | Exceptional 1.1% |