Yakama vs Thai Disability Age Under 5
COMPARE
Yakama
Thai
Disability Age Under 5
Disability Age Under 5 Comparison
Yakama
Thais
1.00%
DISABILITY AGE UNDER 5
100.0/ 100
METRIC RATING
23rd/ 347
METRIC RANK
1.1%
DISABILITY AGE UNDER 5
99.8/ 100
METRIC RATING
41st/ 347
METRIC RANK
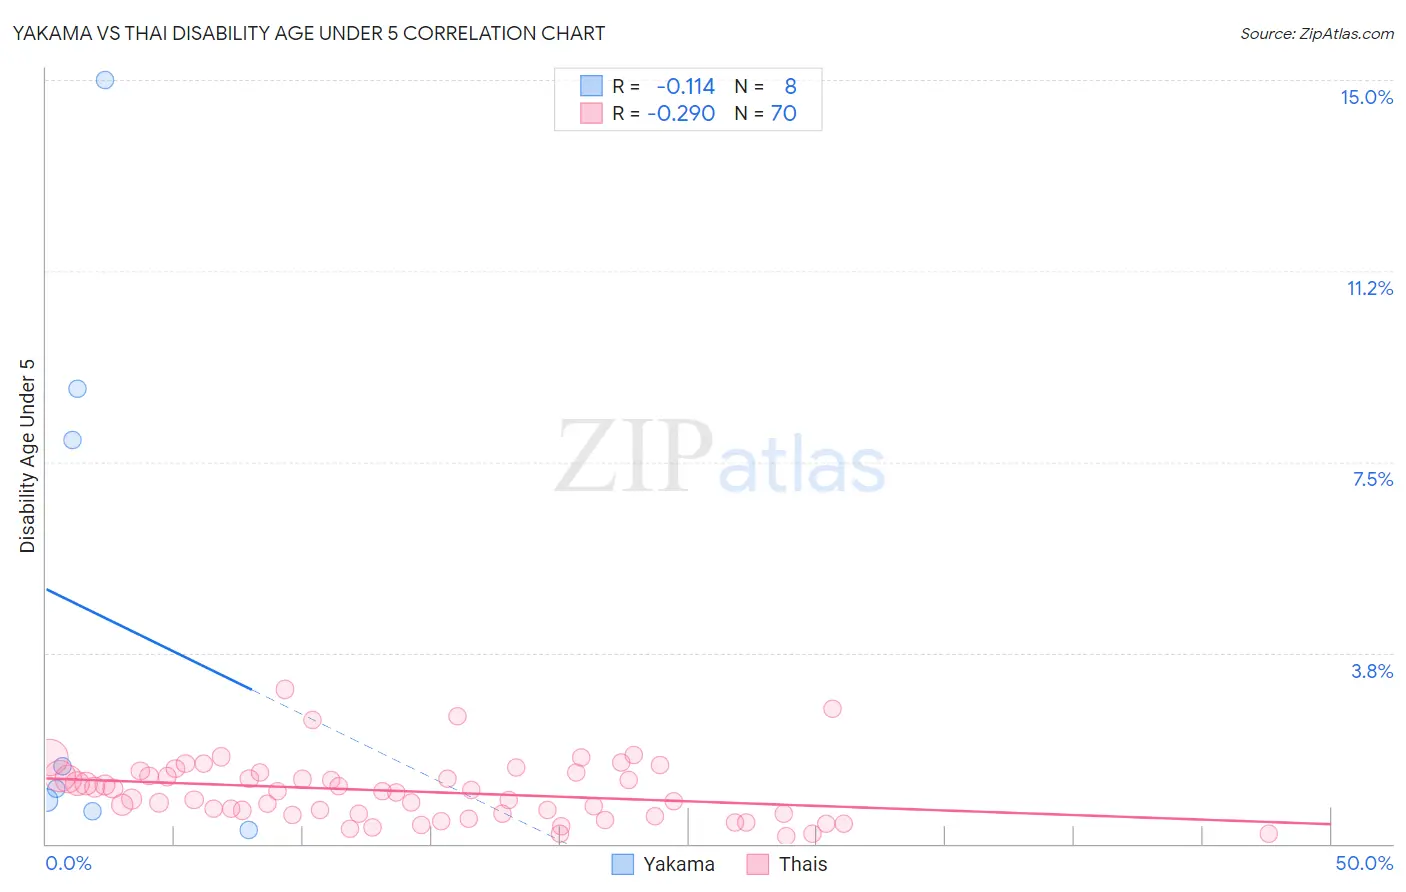
Yakama vs Thai Disability Age Under 5 Correlation Chart
The statistical analysis conducted on geographies consisting of 15,694,723 people shows a poor negative correlation between the proportion of Yakama and percentage of population with a disability under the age of 5 in the United States with a correlation coefficient (R) of -0.114 and weighted average of 1.00%. Similarly, the statistical analysis conducted on geographies consisting of 242,704,166 people shows a weak negative correlation between the proportion of Thais and percentage of population with a disability under the age of 5 in the United States with a correlation coefficient (R) of -0.290 and weighted average of 1.1%, a difference of 6.1%.
Disability Age Under 5 Correlation Summary
| Measurement | Yakama | Thai |
| Minimum | 0.27% | 0.14% |
| Maximum | 15.0% | 3.0% |
| Range | 14.7% | 2.9% |
| Mean | 4.5% | 1.0% |
| Median | 1.3% | 1.0% |
| Interquartile 25% (IQ1) | 0.74% | 0.58% |
| Interquartile 75% (IQ3) | 8.4% | 1.3% |
| Interquartile Range (IQR) | 7.7% | 0.76% |
| Standard Deviation (Sample) | 5.5% | 0.60% |
| Standard Deviation (Population) | 5.1% | 0.60% |
Demographics Similar to Yakama and Thais by Disability Age Under 5
In terms of disability age under 5, the demographic groups most similar to Yakama are Immigrants from Iran (1.00%, a difference of 0.080%), Indian (Asian) (1.0%, a difference of 0.28%), Immigrants from Micronesia (1.0%, a difference of 0.59%), Immigrants from Taiwan (1.0%, a difference of 0.72%), and Guyanese (1.0%, a difference of 1.6%). Similarly, the demographic groups most similar to Thais are Immigrants from Bulgaria (1.1%, a difference of 0.10%), Immigrants from Albania (1.1%, a difference of 0.41%), Filipino (1.1%, a difference of 0.74%), Immigrants from Guyana (1.0%, a difference of 1.4%), and Immigrants from India (1.0%, a difference of 1.5%).
| Demographics | Rating | Rank | Disability Age Under 5 |
| Immigrants | Iran | 100.0 /100 | #22 | Exceptional 1.00% |
| Yakama | 100.0 /100 | #23 | Exceptional 1.00% |
| Indians (Asian) | 100.0 /100 | #24 | Exceptional 1.0% |
| Immigrants | Micronesia | 100.0 /100 | #25 | Exceptional 1.0% |
| Immigrants | Taiwan | 100.0 /100 | #26 | Exceptional 1.0% |
| Guyanese | 100.0 /100 | #27 | Exceptional 1.0% |
| Immigrants | Eastern Asia | 100.0 /100 | #28 | Exceptional 1.0% |
| Immigrants | Belarus | 100.0 /100 | #29 | Exceptional 1.0% |
| Immigrants | South Central Asia | 99.9 /100 | #30 | Exceptional 1.0% |
| Armenians | 99.9 /100 | #31 | Exceptional 1.0% |
| Iranians | 99.9 /100 | #32 | Exceptional 1.0% |
| Bolivians | 99.9 /100 | #33 | Exceptional 1.0% |
| Immigrants | Ukraine | 99.9 /100 | #34 | Exceptional 1.0% |
| Barbadians | 99.9 /100 | #35 | Exceptional 1.0% |
| Immigrants | Nepal | 99.9 /100 | #36 | Exceptional 1.0% |
| Immigrants | India | 99.9 /100 | #37 | Exceptional 1.0% |
| Immigrants | Guyana | 99.9 /100 | #38 | Exceptional 1.0% |
| Filipinos | 99.9 /100 | #39 | Exceptional 1.1% |
| Immigrants | Albania | 99.9 /100 | #40 | Exceptional 1.1% |
| Thais | 99.8 /100 | #41 | Exceptional 1.1% |
| Immigrants | Bulgaria | 99.8 /100 | #42 | Exceptional 1.1% |