Nigerian vs Lithuanian Disability Age Under 5
COMPARE
Nigerian
Lithuanian
Disability Age Under 5
Disability Age Under 5 Comparison
Nigerians
Lithuanians
1.3%
DISABILITY AGE UNDER 5
21.2/ 100
METRIC RATING
207th/ 347
METRIC RANK
1.6%
DISABILITY AGE UNDER 5
0.0/ 100
METRIC RATING
293rd/ 347
METRIC RANK
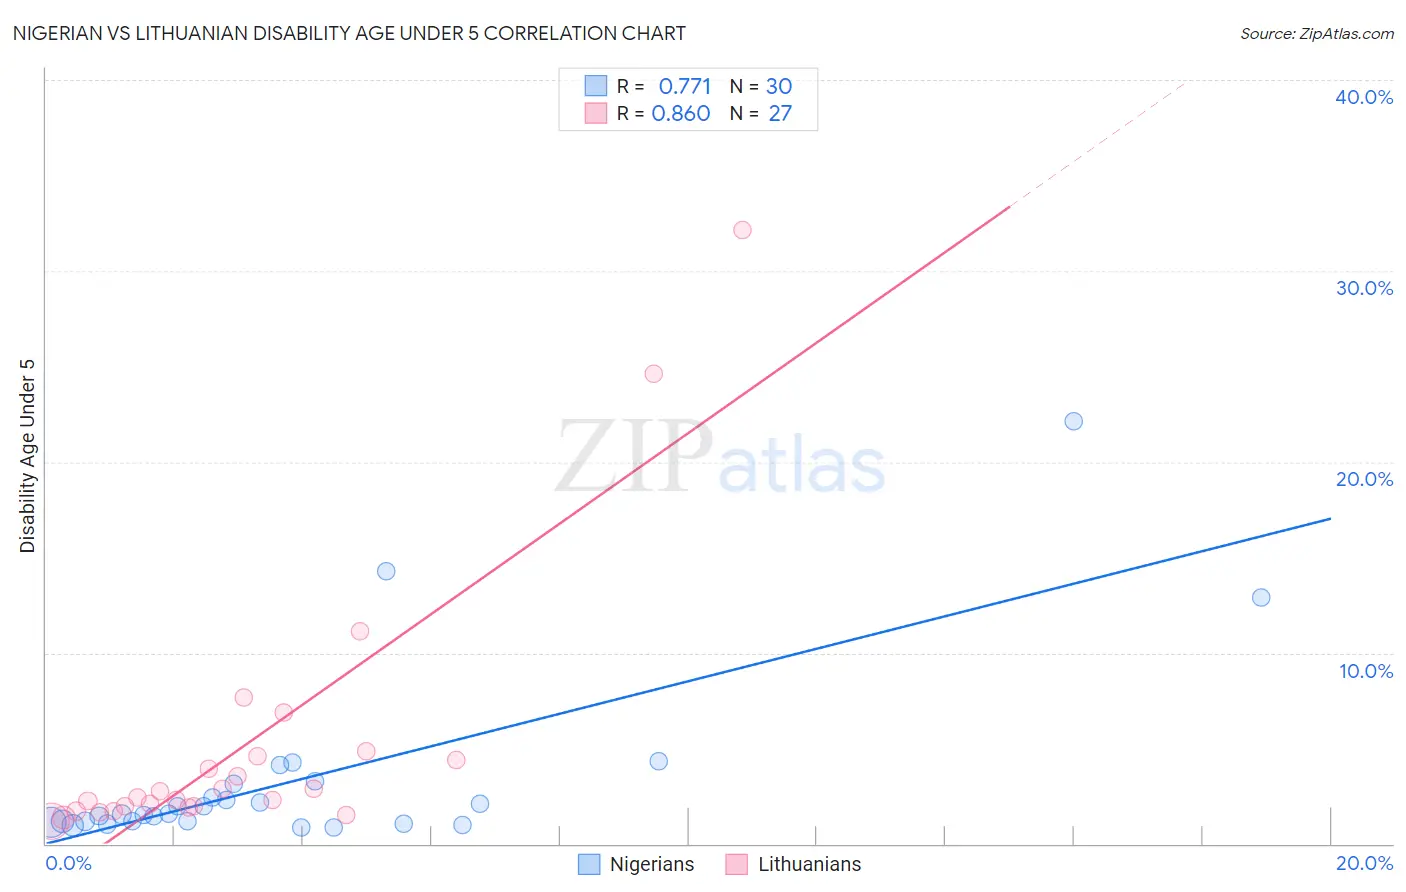
Nigerian vs Lithuanian Disability Age Under 5 Correlation Chart
The statistical analysis conducted on geographies consisting of 194,464,110 people shows a strong positive correlation between the proportion of Nigerians and percentage of population with a disability under the age of 5 in the United States with a correlation coefficient (R) of 0.771 and weighted average of 1.3%. Similarly, the statistical analysis conducted on geographies consisting of 215,672,117 people shows a very strong positive correlation between the proportion of Lithuanians and percentage of population with a disability under the age of 5 in the United States with a correlation coefficient (R) of 0.860 and weighted average of 1.6%, a difference of 22.3%.
Disability Age Under 5 Correlation Summary
| Measurement | Nigerian | Lithuanian |
| Minimum | 0.82% | 1.2% |
| Maximum | 22.1% | 32.1% |
| Range | 21.3% | 31.0% |
| Mean | 3.3% | 5.1% |
| Median | 1.6% | 2.4% |
| Interquartile 25% (IQ1) | 1.2% | 1.9% |
| Interquartile 75% (IQ3) | 3.2% | 4.6% |
| Interquartile Range (IQR) | 2.0% | 2.7% |
| Standard Deviation (Sample) | 4.7% | 7.1% |
| Standard Deviation (Population) | 4.7% | 7.0% |
Similar Demographics by Disability Age Under 5
Demographics Similar to Nigerians by Disability Age Under 5
In terms of disability age under 5, the demographic groups most similar to Nigerians are Mexican (1.3%, a difference of 0.060%), Immigrants from Poland (1.3%, a difference of 0.15%), Romanian (1.3%, a difference of 0.17%), Bulgarian (1.3%, a difference of 0.23%), and Pakistani (1.3%, a difference of 0.24%).
| Demographics | Rating | Rank | Disability Age Under 5 |
| Immigrants | Lithuania | 27.2 /100 | #200 | Fair 1.3% |
| Immigrants | Italy | 25.4 /100 | #201 | Fair 1.3% |
| Arapaho | 24.1 /100 | #202 | Fair 1.3% |
| Liberians | 24.0 /100 | #203 | Fair 1.3% |
| Immigrants | Europe | 23.6 /100 | #204 | Fair 1.3% |
| Romanians | 22.5 /100 | #205 | Fair 1.3% |
| Immigrants | Poland | 22.4 /100 | #206 | Fair 1.3% |
| Nigerians | 21.2 /100 | #207 | Fair 1.3% |
| Mexicans | 20.8 /100 | #208 | Fair 1.3% |
| Bulgarians | 19.5 /100 | #209 | Poor 1.3% |
| Pakistanis | 19.4 /100 | #210 | Poor 1.3% |
| Immigrants | Greece | 19.1 /100 | #211 | Poor 1.3% |
| Chileans | 18.8 /100 | #212 | Poor 1.3% |
| Immigrants | Sudan | 18.7 /100 | #213 | Poor 1.3% |
| Immigrants | Chile | 17.2 /100 | #214 | Poor 1.3% |
Demographics Similar to Lithuanians by Disability Age Under 5
In terms of disability age under 5, the demographic groups most similar to Lithuanians are Italian (1.6%, a difference of 0.46%), Northern European (1.6%, a difference of 0.61%), Czech (1.5%, a difference of 0.70%), Hungarian (1.5%, a difference of 0.83%), and Estonian (1.5%, a difference of 0.97%).
| Demographics | Rating | Rank | Disability Age Under 5 |
| Tlingit-Haida | 0.0 /100 | #286 | Tragic 1.5% |
| Scandinavians | 0.0 /100 | #287 | Tragic 1.5% |
| Estonians | 0.0 /100 | #288 | Tragic 1.5% |
| Hungarians | 0.0 /100 | #289 | Tragic 1.5% |
| Czechs | 0.0 /100 | #290 | Tragic 1.5% |
| Northern Europeans | 0.0 /100 | #291 | Tragic 1.6% |
| Italians | 0.0 /100 | #292 | Tragic 1.6% |
| Lithuanians | 0.0 /100 | #293 | Tragic 1.6% |
| Swedes | 0.0 /100 | #294 | Tragic 1.6% |
| Finns | 0.0 /100 | #295 | Tragic 1.6% |
| Poles | 0.0 /100 | #296 | Tragic 1.6% |
| Immigrants | Nonimmigrants | 0.0 /100 | #297 | Tragic 1.6% |
| Cajuns | 0.0 /100 | #298 | Tragic 1.6% |
| Portuguese | 0.0 /100 | #299 | Tragic 1.6% |
| Shoshone | 0.0 /100 | #300 | Tragic 1.6% |