Slovene vs Thai Disability Age Under 5
COMPARE
Slovene
Thai
Disability Age Under 5
Disability Age Under 5 Comparison
Slovenes
Thais
1.4%
DISABILITY AGE UNDER 5
0.3/ 100
METRIC RATING
257th/ 347
METRIC RANK
1.1%
DISABILITY AGE UNDER 5
99.8/ 100
METRIC RATING
41st/ 347
METRIC RANK
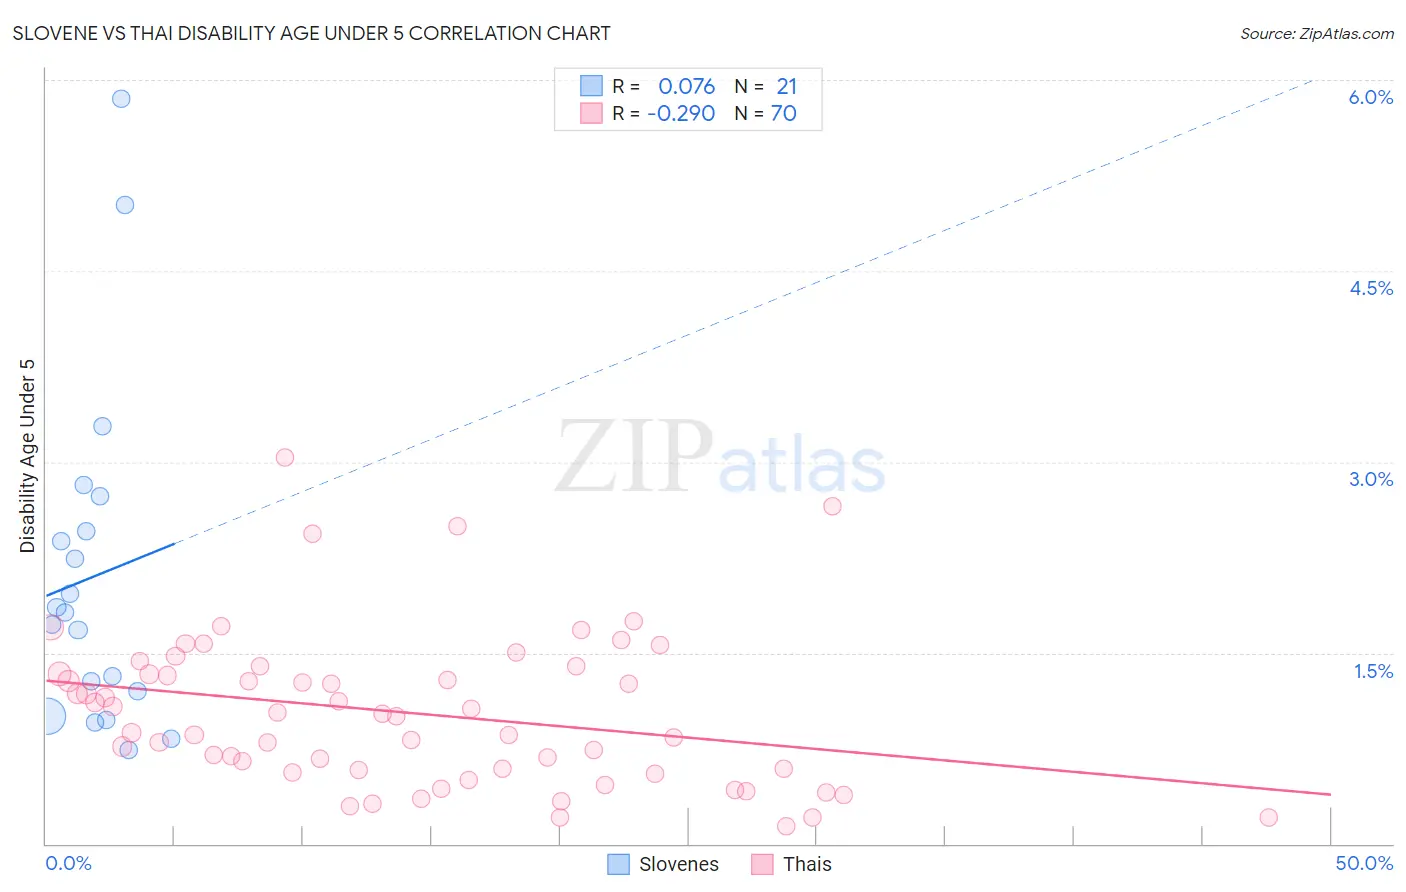
Slovene vs Thai Disability Age Under 5 Correlation Chart
The statistical analysis conducted on geographies consisting of 155,245,072 people shows a slight positive correlation between the proportion of Slovenes and percentage of population with a disability under the age of 5 in the United States with a correlation coefficient (R) of 0.076 and weighted average of 1.4%. Similarly, the statistical analysis conducted on geographies consisting of 242,704,166 people shows a weak negative correlation between the proportion of Thais and percentage of population with a disability under the age of 5 in the United States with a correlation coefficient (R) of -0.290 and weighted average of 1.1%, a difference of 32.1%.
Disability Age Under 5 Correlation Summary
| Measurement | Slovene | Thai |
| Minimum | 0.73% | 0.14% |
| Maximum | 5.9% | 3.0% |
| Range | 5.1% | 2.9% |
| Mean | 2.1% | 1.0% |
| Median | 1.8% | 1.0% |
| Interquartile 25% (IQ1) | 1.1% | 0.58% |
| Interquartile 75% (IQ3) | 2.6% | 1.3% |
| Interquartile Range (IQR) | 1.5% | 0.76% |
| Standard Deviation (Sample) | 1.3% | 0.60% |
| Standard Deviation (Population) | 1.3% | 0.60% |
Similar Demographics by Disability Age Under 5
Demographics Similar to Slovenes by Disability Age Under 5
In terms of disability age under 5, the demographic groups most similar to Slovenes are Costa Rican (1.4%, a difference of 0.19%), Immigrants from Southern Europe (1.4%, a difference of 0.34%), Slavic (1.4%, a difference of 0.55%), Immigrants from Western Europe (1.4%, a difference of 0.89%), and Immigrants from Netherlands (1.4%, a difference of 1.2%).
| Demographics | Rating | Rank | Disability Age Under 5 |
| Africans | 1.0 /100 | #250 | Tragic 1.4% |
| Immigrants | Hungary | 1.0 /100 | #251 | Tragic 1.4% |
| Immigrants | Scotland | 0.9 /100 | #252 | Tragic 1.4% |
| Australians | 0.7 /100 | #253 | Tragic 1.4% |
| Immigrants | Brazil | 0.7 /100 | #254 | Tragic 1.4% |
| Immigrants | Liberia | 0.6 /100 | #255 | Tragic 1.4% |
| Immigrants | Western Europe | 0.5 /100 | #256 | Tragic 1.4% |
| Slovenes | 0.3 /100 | #257 | Tragic 1.4% |
| Costa Ricans | 0.3 /100 | #258 | Tragic 1.4% |
| Immigrants | Southern Europe | 0.3 /100 | #259 | Tragic 1.4% |
| Slavs | 0.3 /100 | #260 | Tragic 1.4% |
| Immigrants | Netherlands | 0.2 /100 | #261 | Tragic 1.4% |
| Immigrants | Dominica | 0.2 /100 | #262 | Tragic 1.4% |
| Spanish | 0.2 /100 | #263 | Tragic 1.4% |
| Yugoslavians | 0.1 /100 | #264 | Tragic 1.4% |
Demographics Similar to Thais by Disability Age Under 5
In terms of disability age under 5, the demographic groups most similar to Thais are Immigrants from Bulgaria (1.1%, a difference of 0.10%), Pima (1.1%, a difference of 0.11%), Immigrants from Asia (1.1%, a difference of 0.21%), Immigrants from Albania (1.1%, a difference of 0.41%), and Immigrants from Turkey (1.1%, a difference of 0.43%).
| Demographics | Rating | Rank | Disability Age Under 5 |
| Immigrants | Ukraine | 99.9 /100 | #34 | Exceptional 1.0% |
| Barbadians | 99.9 /100 | #35 | Exceptional 1.0% |
| Immigrants | Nepal | 99.9 /100 | #36 | Exceptional 1.0% |
| Immigrants | India | 99.9 /100 | #37 | Exceptional 1.0% |
| Immigrants | Guyana | 99.9 /100 | #38 | Exceptional 1.0% |
| Filipinos | 99.9 /100 | #39 | Exceptional 1.1% |
| Immigrants | Albania | 99.9 /100 | #40 | Exceptional 1.1% |
| Thais | 99.8 /100 | #41 | Exceptional 1.1% |
| Immigrants | Bulgaria | 99.8 /100 | #42 | Exceptional 1.1% |
| Pima | 99.8 /100 | #43 | Exceptional 1.1% |
| Immigrants | Asia | 99.8 /100 | #44 | Exceptional 1.1% |
| Immigrants | Turkey | 99.8 /100 | #45 | Exceptional 1.1% |
| Immigrants | Congo | 99.8 /100 | #46 | Exceptional 1.1% |
| Immigrants | Sweden | 99.8 /100 | #47 | Exceptional 1.1% |
| Immigrants | Singapore | 99.7 /100 | #48 | Exceptional 1.1% |