Nigerian vs Thai 4th Grade
COMPARE
Nigerian
Thai
4th Grade
4th Grade Comparison
Nigerians
Thais
97.1%
4TH GRADE
1.8/ 100
METRIC RATING
239th/ 347
METRIC RANK
97.8%
4TH GRADE
96.7/ 100
METRIC RATING
110th/ 347
METRIC RANK
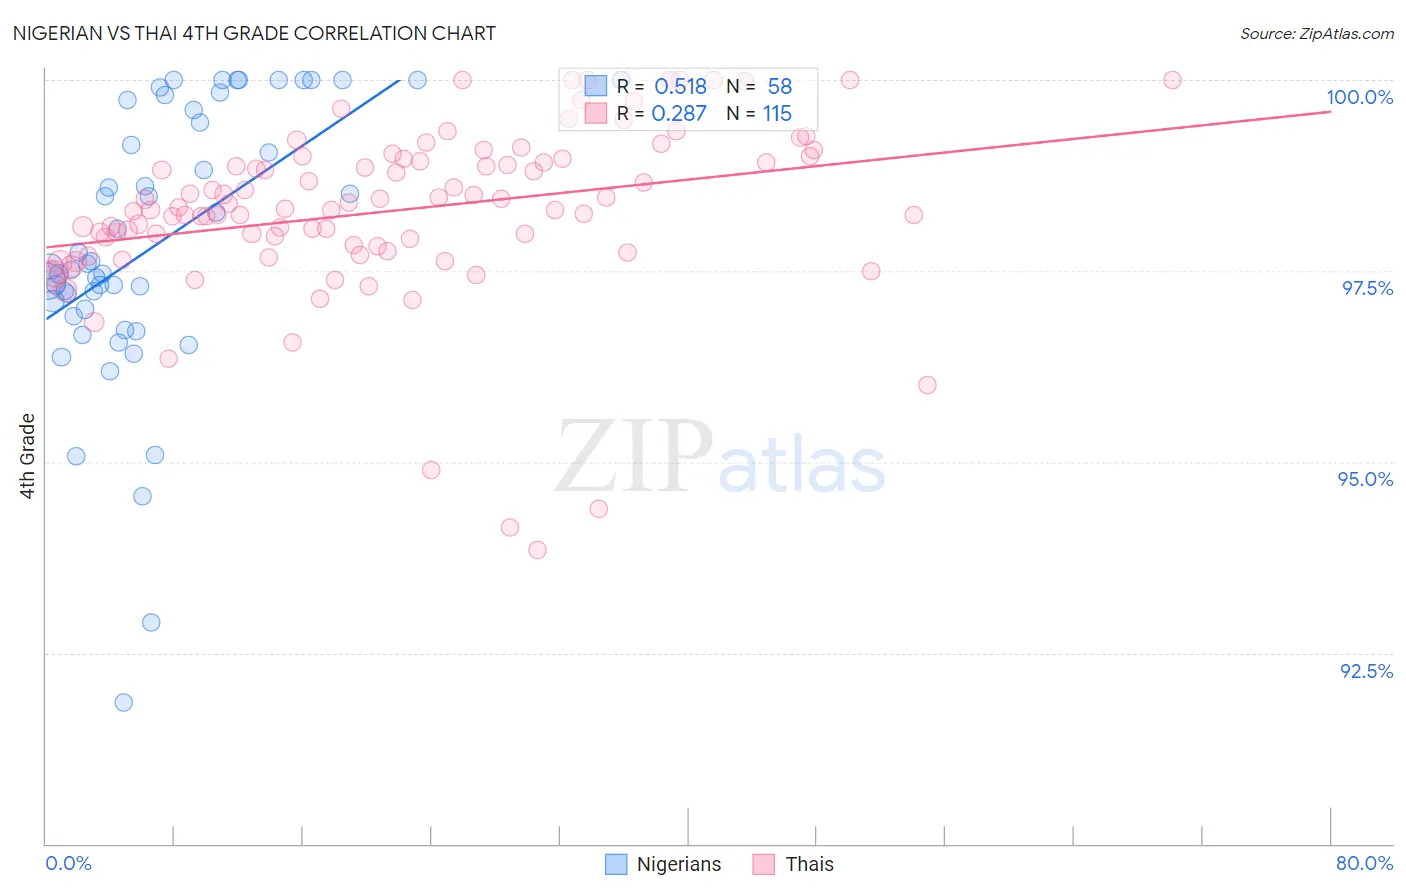
Nigerian vs Thai 4th Grade Correlation Chart
The statistical analysis conducted on geographies consisting of 332,724,627 people shows a substantial positive correlation between the proportion of Nigerians and percentage of population with at least 4th grade education in the United States with a correlation coefficient (R) of 0.518 and weighted average of 97.1%. Similarly, the statistical analysis conducted on geographies consisting of 475,866,115 people shows a weak positive correlation between the proportion of Thais and percentage of population with at least 4th grade education in the United States with a correlation coefficient (R) of 0.287 and weighted average of 97.8%, a difference of 0.70%.
4th Grade Correlation Summary
| Measurement | Nigerian | Thai |
| Minimum | 91.9% | 93.8% |
| Maximum | 100.0% | 100.0% |
| Range | 8.1% | 6.2% |
| Mean | 97.9% | 98.3% |
| Median | 97.6% | 98.3% |
| Interquartile 25% (IQ1) | 97.0% | 97.8% |
| Interquartile 75% (IQ3) | 99.6% | 99.0% |
| Interquartile Range (IQR) | 2.6% | 1.1% |
| Standard Deviation (Sample) | 1.8% | 1.1% |
| Standard Deviation (Population) | 1.8% | 1.1% |
Similar Demographics by 4th Grade
Demographics Similar to Nigerians by 4th Grade
In terms of 4th grade, the demographic groups most similar to Nigerians are Immigrants from Costa Rica (97.2%, a difference of 0.010%), Indian (Asian) (97.2%, a difference of 0.010%), Colombian (97.1%, a difference of 0.010%), Immigrants from Indonesia (97.1%, a difference of 0.010%), and Asian (97.1%, a difference of 0.020%).
| Demographics | Rating | Rank | 4th Grade |
| Immigrants | Western Asia | 3.4 /100 | #232 | Tragic 97.2% |
| Senegalese | 3.1 /100 | #233 | Tragic 97.2% |
| Assyrians/Chaldeans/Syriacs | 3.0 /100 | #234 | Tragic 97.2% |
| Yuman | 2.9 /100 | #235 | Tragic 97.2% |
| Immigrants | Eastern Asia | 2.7 /100 | #236 | Tragic 97.2% |
| Immigrants | Costa Rica | 2.0 /100 | #237 | Tragic 97.2% |
| Indians (Asian) | 1.9 /100 | #238 | Tragic 97.2% |
| Nigerians | 1.8 /100 | #239 | Tragic 97.1% |
| Colombians | 1.6 /100 | #240 | Tragic 97.1% |
| Immigrants | Indonesia | 1.5 /100 | #241 | Tragic 97.1% |
| Asians | 1.4 /100 | #242 | Tragic 97.1% |
| U.S. Virgin Islanders | 1.4 /100 | #243 | Tragic 97.1% |
| Koreans | 1.3 /100 | #244 | Tragic 97.1% |
| Immigrants | Eastern Africa | 1.2 /100 | #245 | Tragic 97.1% |
| Immigrants | Uruguay | 1.2 /100 | #246 | Tragic 97.1% |
Demographics Similar to Thais by 4th Grade
In terms of 4th grade, the demographic groups most similar to Thais are Immigrants from Latvia (97.8%, a difference of 0.0%), Immigrants from Switzerland (97.8%, a difference of 0.010%), Bhutanese (97.9%, a difference of 0.020%), Immigrants from Singapore (97.9%, a difference of 0.020%), and Okinawan (97.8%, a difference of 0.020%).
| Demographics | Rating | Rank | 4th Grade |
| Puget Sound Salish | 97.7 /100 | #103 | Exceptional 97.9% |
| Immigrants | Nonimmigrants | 97.5 /100 | #104 | Exceptional 97.9% |
| German Russians | 97.5 /100 | #105 | Exceptional 97.9% |
| Immigrants | Czechoslovakia | 97.5 /100 | #106 | Exceptional 97.9% |
| Bhutanese | 97.4 /100 | #107 | Exceptional 97.9% |
| Immigrants | Singapore | 97.3 /100 | #108 | Exceptional 97.9% |
| Immigrants | Latvia | 96.8 /100 | #109 | Exceptional 97.8% |
| Thais | 96.7 /100 | #110 | Exceptional 97.8% |
| Immigrants | Switzerland | 96.1 /100 | #111 | Exceptional 97.8% |
| Okinawans | 96.0 /100 | #112 | Exceptional 97.8% |
| Basques | 95.8 /100 | #113 | Exceptional 97.8% |
| Iroquois | 95.4 /100 | #114 | Exceptional 97.8% |
| Lebanese | 95.4 /100 | #115 | Exceptional 97.8% |
| Immigrants | Croatia | 95.2 /100 | #116 | Exceptional 97.8% |
| Syrians | 94.9 /100 | #117 | Exceptional 97.8% |