Slovene vs Tohono O'odham Hearing Disability
COMPARE
Slovene
Tohono O'odham
Hearing Disability
Hearing Disability Comparison
Slovenes
Tohono O'odham
3.5%
HEARING DISABILITY
0.1/ 100
METRIC RATING
259th/ 347
METRIC RANK
4.2%
HEARING DISABILITY
0.0/ 100
METRIC RATING
328th/ 347
METRIC RANK
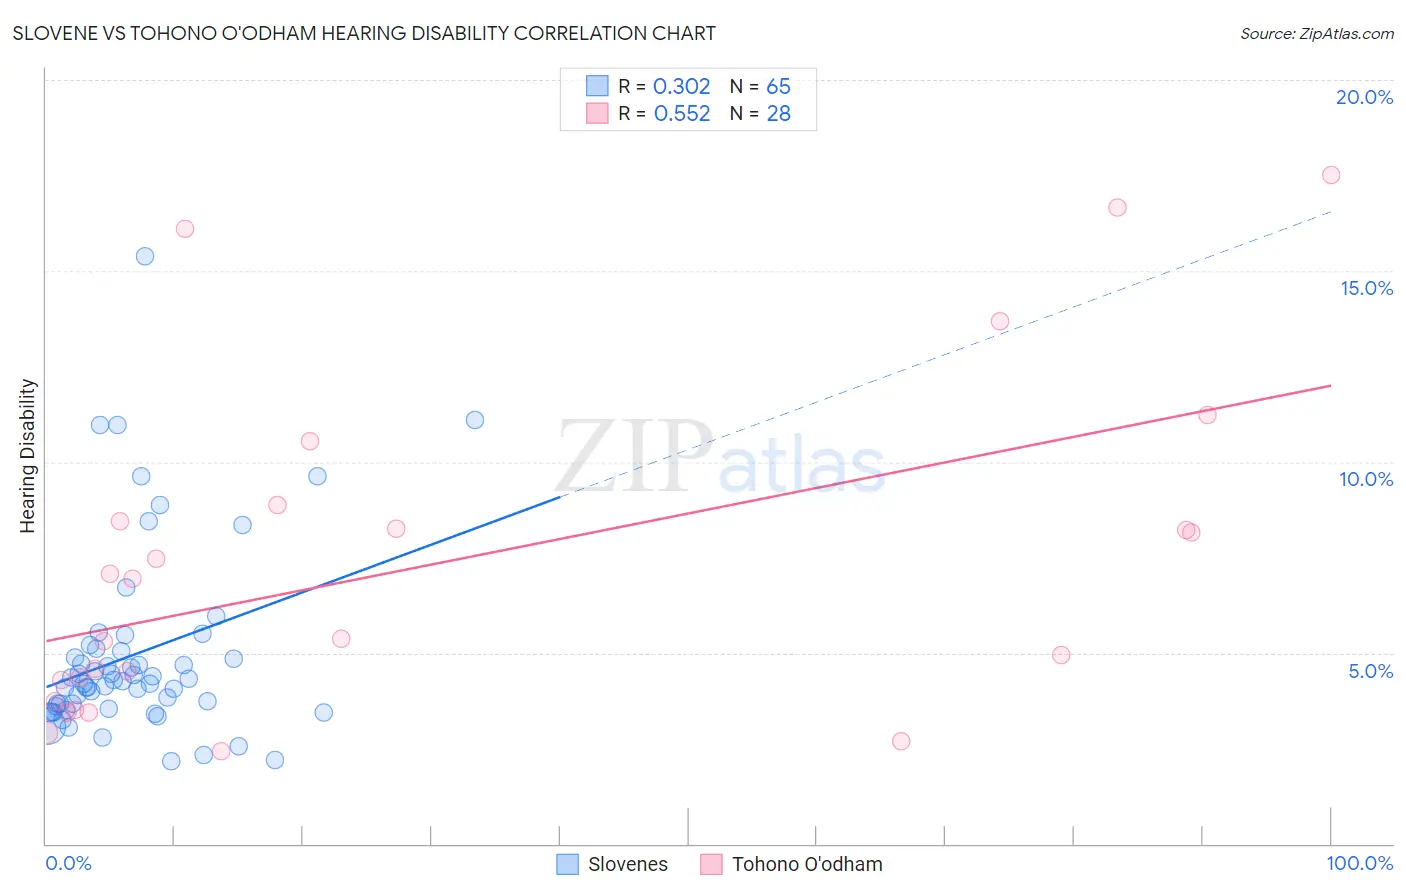
Slovene vs Tohono O'odham Hearing Disability Correlation Chart
The statistical analysis conducted on geographies consisting of 261,288,798 people shows a mild positive correlation between the proportion of Slovenes and percentage of population with hearing disability in the United States with a correlation coefficient (R) of 0.302 and weighted average of 3.5%. Similarly, the statistical analysis conducted on geographies consisting of 58,715,422 people shows a substantial positive correlation between the proportion of Tohono O'odham and percentage of population with hearing disability in the United States with a correlation coefficient (R) of 0.552 and weighted average of 4.2%, a difference of 20.5%.
Hearing Disability Correlation Summary
| Measurement | Slovene | Tohono O'odham |
| Minimum | 2.2% | 2.4% |
| Maximum | 15.4% | 17.5% |
| Range | 13.2% | 15.1% |
| Mean | 5.0% | 7.3% |
| Median | 4.3% | 6.1% |
| Interquartile 25% (IQ1) | 3.6% | 4.0% |
| Interquartile 75% (IQ3) | 5.1% | 8.7% |
| Interquartile Range (IQR) | 1.5% | 4.7% |
| Standard Deviation (Sample) | 2.5% | 4.3% |
| Standard Deviation (Population) | 2.4% | 4.3% |
Similar Demographics by Hearing Disability
Demographics Similar to Slovenes by Hearing Disability
In terms of hearing disability, the demographic groups most similar to Slovenes are Portuguese (3.5%, a difference of 0.080%), Hawaiian (3.5%, a difference of 0.11%), Immigrants from North America (3.5%, a difference of 0.23%), Northern European (3.4%, a difference of 0.24%), and Immigrants from Canada (3.5%, a difference of 0.27%).
| Demographics | Rating | Rank | Hearing Disability |
| Croatians | 0.4 /100 | #252 | Tragic 3.4% |
| Carpatho Rusyns | 0.3 /100 | #253 | Tragic 3.4% |
| Slavs | 0.2 /100 | #254 | Tragic 3.4% |
| Poles | 0.2 /100 | #255 | Tragic 3.4% |
| Hmong | 0.2 /100 | #256 | Tragic 3.4% |
| Yaqui | 0.2 /100 | #257 | Tragic 3.4% |
| Northern Europeans | 0.2 /100 | #258 | Tragic 3.4% |
| Slovenes | 0.1 /100 | #259 | Tragic 3.5% |
| Portuguese | 0.1 /100 | #260 | Tragic 3.5% |
| Hawaiians | 0.1 /100 | #261 | Tragic 3.5% |
| Immigrants | North America | 0.1 /100 | #262 | Tragic 3.5% |
| Immigrants | Canada | 0.1 /100 | #263 | Tragic 3.5% |
| Immigrants | Germany | 0.1 /100 | #264 | Tragic 3.5% |
| British | 0.1 /100 | #265 | Tragic 3.5% |
| Belgians | 0.1 /100 | #266 | Tragic 3.5% |
Demographics Similar to Tohono O'odham by Hearing Disability
In terms of hearing disability, the demographic groups most similar to Tohono O'odham are Crow (4.2%, a difference of 0.010%), Arapaho (4.1%, a difference of 0.38%), Native/Alaskan (4.2%, a difference of 0.80%), Cherokee (4.2%, a difference of 0.95%), and Potawatomi (4.1%, a difference of 1.1%).
| Demographics | Rating | Rank | Hearing Disability |
| Paiute | 0.0 /100 | #321 | Tragic 4.1% |
| Seminole | 0.0 /100 | #322 | Tragic 4.1% |
| Apache | 0.0 /100 | #323 | Tragic 4.1% |
| Osage | 0.0 /100 | #324 | Tragic 4.1% |
| Lumbee | 0.0 /100 | #325 | Tragic 4.1% |
| Potawatomi | 0.0 /100 | #326 | Tragic 4.1% |
| Arapaho | 0.0 /100 | #327 | Tragic 4.1% |
| Tohono O'odham | 0.0 /100 | #328 | Tragic 4.2% |
| Crow | 0.0 /100 | #329 | Tragic 4.2% |
| Natives/Alaskans | 0.0 /100 | #330 | Tragic 4.2% |
| Cherokee | 0.0 /100 | #331 | Tragic 4.2% |
| Houma | 0.0 /100 | #332 | Tragic 4.2% |
| Dutch West Indians | 0.0 /100 | #333 | Tragic 4.3% |
| Aleuts | 0.0 /100 | #334 | Tragic 4.3% |
| Kiowa | 0.0 /100 | #335 | Tragic 4.3% |