New Zealander vs Immigrants from Thailand Hearing Disability
COMPARE
New Zealander
Immigrants from Thailand
Hearing Disability
Hearing Disability Comparison
New Zealanders
Immigrants from Thailand
3.2%
HEARING DISABILITY
6.8/ 100
METRIC RATING
219th/ 347
METRIC RANK
3.1%
HEARING DISABILITY
16.4/ 100
METRIC RATING
202nd/ 347
METRIC RANK
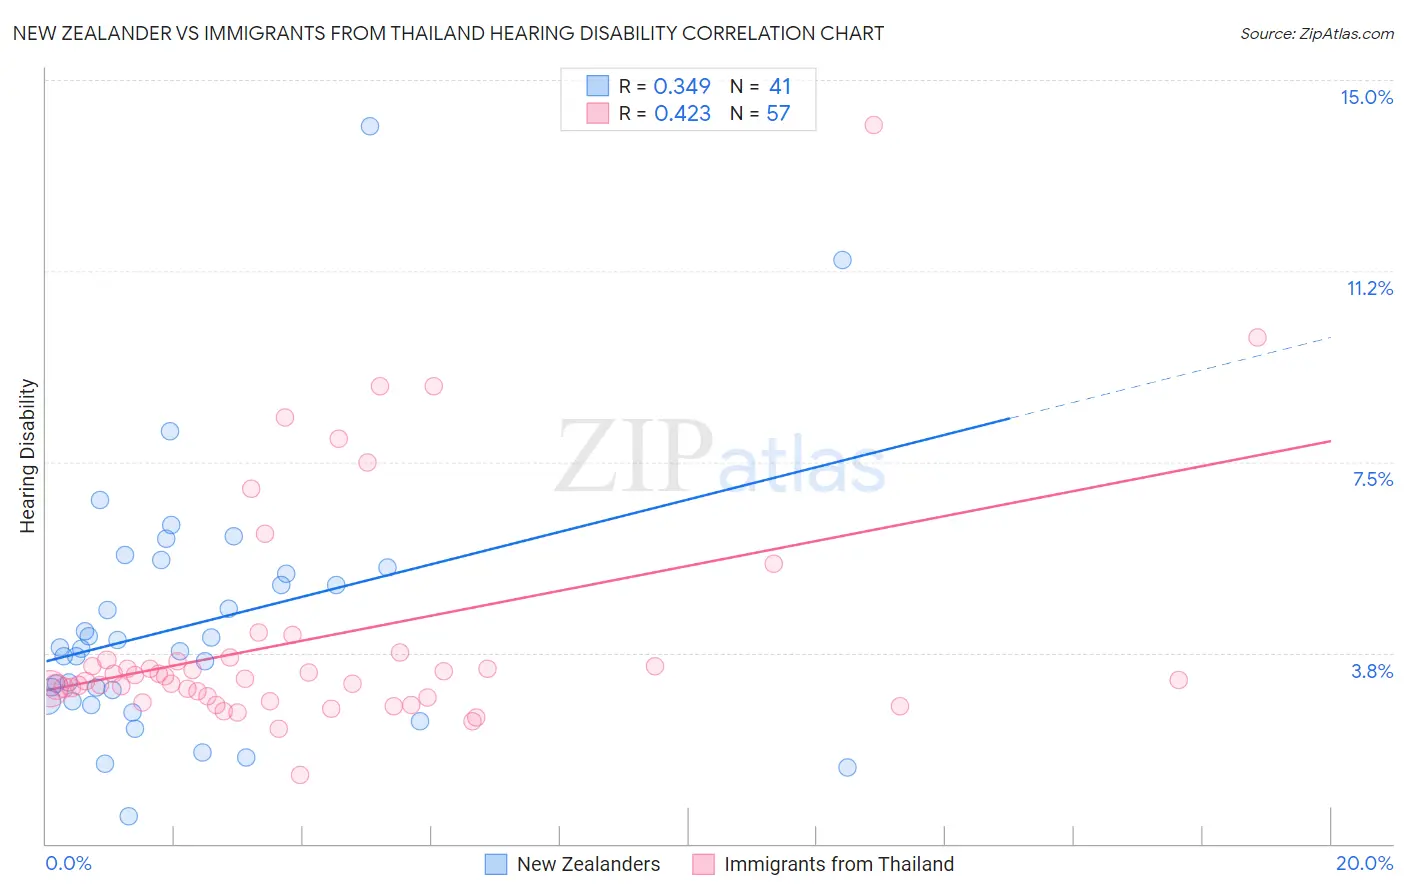
New Zealander vs Immigrants from Thailand Hearing Disability Correlation Chart
The statistical analysis conducted on geographies consisting of 106,920,080 people shows a mild positive correlation between the proportion of New Zealanders and percentage of population with hearing disability in the United States with a correlation coefficient (R) of 0.349 and weighted average of 3.2%. Similarly, the statistical analysis conducted on geographies consisting of 316,957,288 people shows a moderate positive correlation between the proportion of Immigrants from Thailand and percentage of population with hearing disability in the United States with a correlation coefficient (R) of 0.423 and weighted average of 3.1%, a difference of 2.2%.
Hearing Disability Correlation Summary
| Measurement | New Zealander | Immigrants from Thailand |
| Minimum | 0.53% | 1.3% |
| Maximum | 14.1% | 14.1% |
| Range | 13.6% | 12.8% |
| Mean | 4.3% | 4.0% |
| Median | 3.8% | 3.2% |
| Interquartile 25% (IQ1) | 2.8% | 2.9% |
| Interquartile 75% (IQ3) | 5.4% | 3.6% |
| Interquartile Range (IQR) | 2.6% | 0.74% |
| Standard Deviation (Sample) | 2.5% | 2.3% |
| Standard Deviation (Population) | 2.5% | 2.3% |
Demographics Similar to New Zealanders and Immigrants from Thailand by Hearing Disability
In terms of hearing disability, the demographic groups most similar to New Zealanders are Immigrants from Northern Europe (3.2%, a difference of 0.060%), Malaysian (3.2%, a difference of 0.060%), Russian (3.2%, a difference of 0.10%), Immigrants from Norway (3.2%, a difference of 0.17%), and Bangladeshi (3.2%, a difference of 0.41%). Similarly, the demographic groups most similar to Immigrants from Thailand are Immigrants from Denmark (3.1%, a difference of 0.040%), Immigrants from Czechoslovakia (3.1%, a difference of 0.090%), Alsatian (3.1%, a difference of 0.090%), Eastern European (3.1%, a difference of 0.16%), and Hispanic or Latino (3.1%, a difference of 0.22%).
| Demographics | Rating | Rank | Hearing Disability |
| Immigrants | North Macedonia | 19.1 /100 | #200 | Poor 3.1% |
| Iraqis | 19.0 /100 | #201 | Poor 3.1% |
| Immigrants | Thailand | 16.4 /100 | #202 | Poor 3.1% |
| Immigrants | Denmark | 16.2 /100 | #203 | Poor 3.1% |
| Immigrants | Czechoslovakia | 15.9 /100 | #204 | Poor 3.1% |
| Alsatians | 15.9 /100 | #205 | Poor 3.1% |
| Eastern Europeans | 15.5 /100 | #206 | Poor 3.1% |
| Hispanics or Latinos | 15.1 /100 | #207 | Poor 3.1% |
| Immigrants | Latvia | 12.7 /100 | #208 | Poor 3.1% |
| Immigrants | Hungary | 12.5 /100 | #209 | Poor 3.1% |
| Cape Verdeans | 12.2 /100 | #210 | Poor 3.1% |
| Romanians | 12.1 /100 | #211 | Poor 3.1% |
| Pakistanis | 11.1 /100 | #212 | Poor 3.1% |
| Immigrants | Iraq | 10.5 /100 | #213 | Poor 3.1% |
| Australians | 8.1 /100 | #214 | Tragic 3.2% |
| Bangladeshis | 8.1 /100 | #215 | Tragic 3.2% |
| Immigrants | Norway | 7.3 /100 | #216 | Tragic 3.2% |
| Russians | 7.1 /100 | #217 | Tragic 3.2% |
| Immigrants | Northern Europe | 7.0 /100 | #218 | Tragic 3.2% |
| New Zealanders | 6.8 /100 | #219 | Tragic 3.2% |
| Malaysians | 6.6 /100 | #220 | Tragic 3.2% |