New Zealander vs Immigrants from Korea Hearing Disability
COMPARE
New Zealander
Immigrants from Korea
Hearing Disability
Hearing Disability Comparison
New Zealanders
Immigrants from Korea
3.2%
HEARING DISABILITY
6.8/ 100
METRIC RATING
219th/ 347
METRIC RANK
2.7%
HEARING DISABILITY
97.5/ 100
METRIC RATING
74th/ 347
METRIC RANK
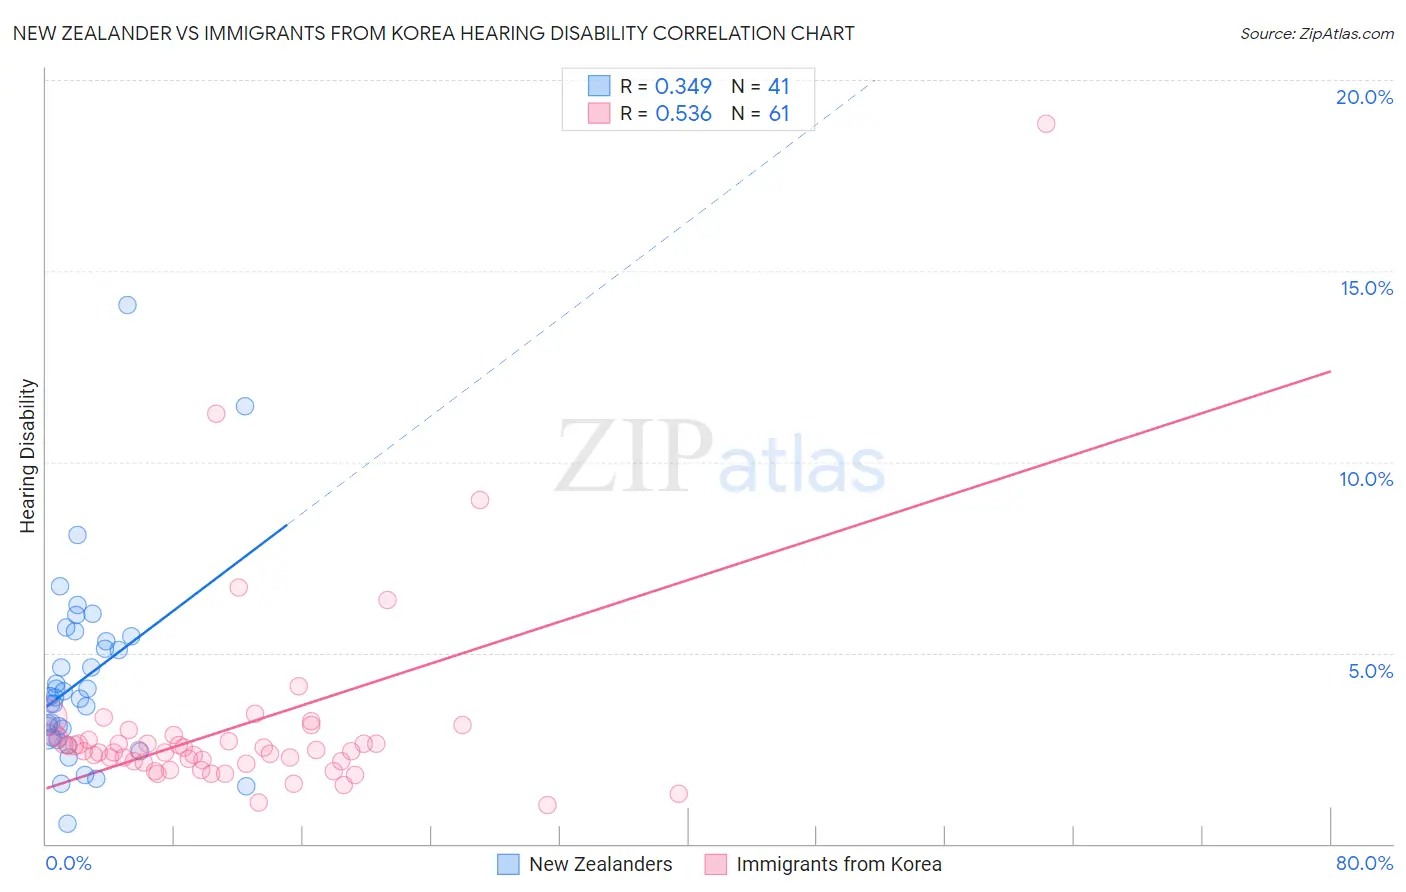
New Zealander vs Immigrants from Korea Hearing Disability Correlation Chart
The statistical analysis conducted on geographies consisting of 106,920,080 people shows a mild positive correlation between the proportion of New Zealanders and percentage of population with hearing disability in the United States with a correlation coefficient (R) of 0.349 and weighted average of 3.2%. Similarly, the statistical analysis conducted on geographies consisting of 416,138,137 people shows a substantial positive correlation between the proportion of Immigrants from Korea and percentage of population with hearing disability in the United States with a correlation coefficient (R) of 0.536 and weighted average of 2.7%, a difference of 16.2%.
Hearing Disability Correlation Summary
| Measurement | New Zealander | Immigrants from Korea |
| Minimum | 0.53% | 1.0% |
| Maximum | 14.1% | 18.9% |
| Range | 13.6% | 17.8% |
| Mean | 4.3% | 3.1% |
| Median | 3.8% | 2.5% |
| Interquartile 25% (IQ1) | 2.8% | 2.1% |
| Interquartile 75% (IQ3) | 5.4% | 2.8% |
| Interquartile Range (IQR) | 2.6% | 0.67% |
| Standard Deviation (Sample) | 2.5% | 2.6% |
| Standard Deviation (Population) | 2.5% | 2.6% |
Similar Demographics by Hearing Disability
Demographics Similar to New Zealanders by Hearing Disability
In terms of hearing disability, the demographic groups most similar to New Zealanders are Immigrants from Northern Europe (3.2%, a difference of 0.060%), Malaysian (3.2%, a difference of 0.060%), Immigrants from Laos (3.2%, a difference of 0.060%), Russian (3.2%, a difference of 0.10%), and Immigrants from Oceania (3.2%, a difference of 0.10%).
| Demographics | Rating | Rank | Hearing Disability |
| Pakistanis | 11.1 /100 | #212 | Poor 3.1% |
| Immigrants | Iraq | 10.5 /100 | #213 | Poor 3.1% |
| Australians | 8.1 /100 | #214 | Tragic 3.2% |
| Bangladeshis | 8.1 /100 | #215 | Tragic 3.2% |
| Immigrants | Norway | 7.3 /100 | #216 | Tragic 3.2% |
| Russians | 7.1 /100 | #217 | Tragic 3.2% |
| Immigrants | Northern Europe | 7.0 /100 | #218 | Tragic 3.2% |
| New Zealanders | 6.8 /100 | #219 | Tragic 3.2% |
| Malaysians | 6.6 /100 | #220 | Tragic 3.2% |
| Immigrants | Laos | 6.6 /100 | #221 | Tragic 3.2% |
| Immigrants | Oceania | 6.5 /100 | #222 | Tragic 3.2% |
| Mexicans | 5.6 /100 | #223 | Tragic 3.2% |
| Icelanders | 5.2 /100 | #224 | Tragic 3.2% |
| Latvians | 5.1 /100 | #225 | Tragic 3.2% |
| Lebanese | 5.0 /100 | #226 | Tragic 3.2% |
Demographics Similar to Immigrants from Korea by Hearing Disability
In terms of hearing disability, the demographic groups most similar to Immigrants from Korea are Argentinean (2.7%, a difference of 0.0%), Immigrants from Saudi Arabia (2.7%, a difference of 0.030%), Asian (2.7%, a difference of 0.030%), Immigrants from Malaysia (2.7%, a difference of 0.050%), and Afghan (2.7%, a difference of 0.080%).
| Demographics | Rating | Rank | Hearing Disability |
| Egyptians | 98.1 /100 | #67 | Exceptional 2.7% |
| Immigrants | Africa | 98.0 /100 | #68 | Exceptional 2.7% |
| Nicaraguans | 97.9 /100 | #69 | Exceptional 2.7% |
| Peruvians | 97.7 /100 | #70 | Exceptional 2.7% |
| Central Americans | 97.7 /100 | #71 | Exceptional 2.7% |
| Afghans | 97.6 /100 | #72 | Exceptional 2.7% |
| Argentineans | 97.5 /100 | #73 | Exceptional 2.7% |
| Immigrants | Korea | 97.5 /100 | #74 | Exceptional 2.7% |
| Immigrants | Saudi Arabia | 97.5 /100 | #75 | Exceptional 2.7% |
| Asians | 97.5 /100 | #76 | Exceptional 2.7% |
| Immigrants | Malaysia | 97.5 /100 | #77 | Exceptional 2.7% |
| Mongolians | 97.4 /100 | #78 | Exceptional 2.7% |
| Colombians | 97.4 /100 | #79 | Exceptional 2.7% |
| Immigrants | Asia | 97.2 /100 | #80 | Exceptional 2.7% |
| Immigrants | Uruguay | 97.2 /100 | #81 | Exceptional 2.7% |