Nepalese vs South American Indian College, Under 1 year
COMPARE
Nepalese
South American Indian
College, Under 1 year
College, Under 1 year Comparison
Nepalese
South American Indians
62.2%
COLLEGE, UNDER 1 YEAR
1.1/ 100
METRIC RATING
239th/ 347
METRIC RANK
65.5%
COLLEGE, UNDER 1 YEAR
54.4/ 100
METRIC RATING
172nd/ 347
METRIC RANK
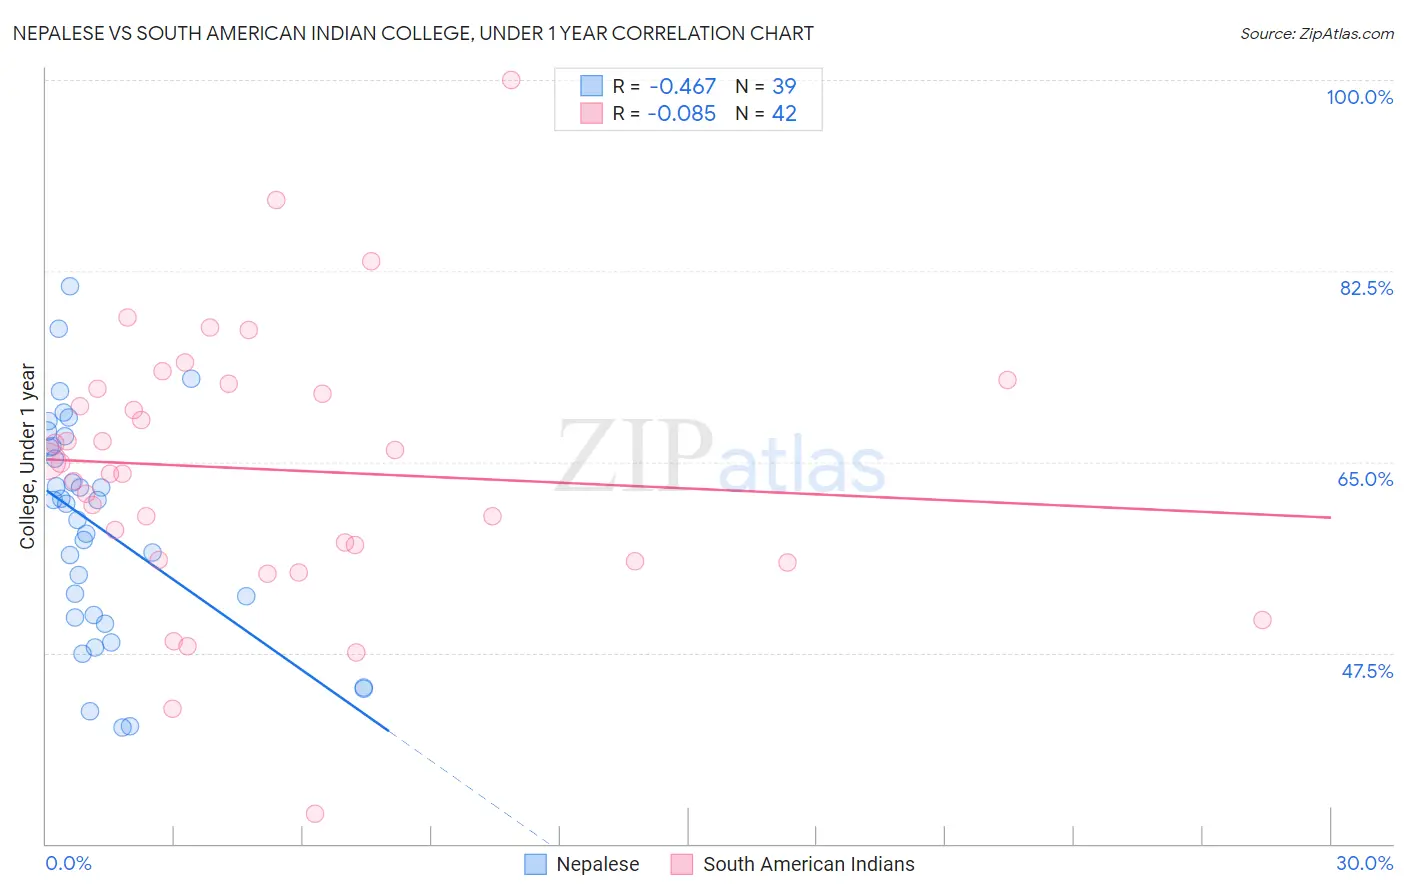
Nepalese vs South American Indian College, Under 1 year Correlation Chart
The statistical analysis conducted on geographies consisting of 24,519,269 people shows a moderate negative correlation between the proportion of Nepalese and percentage of population with at least college, under 1 year education in the United States with a correlation coefficient (R) of -0.467 and weighted average of 62.2%. Similarly, the statistical analysis conducted on geographies consisting of 164,573,280 people shows a slight negative correlation between the proportion of South American Indians and percentage of population with at least college, under 1 year education in the United States with a correlation coefficient (R) of -0.085 and weighted average of 65.5%, a difference of 5.4%.
College, Under 1 year Correlation Summary
| Measurement | Nepalese | South American Indian |
| Minimum | 40.7% | 32.7% |
| Maximum | 81.1% | 100.0% |
| Range | 40.5% | 67.3% |
| Mean | 58.9% | 64.3% |
| Median | 61.2% | 64.4% |
| Interquartile 25% (IQ1) | 50.7% | 56.0% |
| Interquartile 75% (IQ3) | 66.4% | 71.7% |
| Interquartile Range (IQR) | 15.7% | 15.7% |
| Standard Deviation (Sample) | 10.2% | 12.4% |
| Standard Deviation (Population) | 10.0% | 12.3% |
Similar Demographics by College, Under 1 year
Demographics Similar to Nepalese by College, Under 1 year
In terms of college, under 1 year, the demographic groups most similar to Nepalese are Aleut (62.2%, a difference of 0.0%), Ottawa (62.2%, a difference of 0.010%), Malaysian (62.2%, a difference of 0.060%), Hawaiian (62.1%, a difference of 0.090%), and Colville (62.1%, a difference of 0.18%).
| Demographics | Rating | Rank | College, Under 1 year |
| Osage | 2.2 /100 | #232 | Tragic 62.7% |
| Iroquois | 2.0 /100 | #233 | Tragic 62.6% |
| Chippewa | 2.0 /100 | #234 | Tragic 62.6% |
| Spanish Americans | 1.9 /100 | #235 | Tragic 62.6% |
| Immigrants | Immigrants | 1.7 /100 | #236 | Tragic 62.5% |
| Immigrants | Burma/Myanmar | 1.6 /100 | #237 | Tragic 62.5% |
| French American Indians | 1.5 /100 | #238 | Tragic 62.4% |
| Nepalese | 1.1 /100 | #239 | Tragic 62.2% |
| Aleuts | 1.1 /100 | #240 | Tragic 62.2% |
| Ottawa | 1.1 /100 | #241 | Tragic 62.2% |
| Malaysians | 1.1 /100 | #242 | Tragic 62.2% |
| Hawaiians | 1.1 /100 | #243 | Tragic 62.1% |
| Colville | 1.0 /100 | #244 | Tragic 62.1% |
| Delaware | 0.9 /100 | #245 | Tragic 62.1% |
| Marshallese | 0.8 /100 | #246 | Tragic 61.9% |
Demographics Similar to South American Indians by College, Under 1 year
In terms of college, under 1 year, the demographic groups most similar to South American Indians are Swiss (65.5%, a difference of 0.020%), Immigrants from Oceania (65.6%, a difference of 0.030%), Yugoslavian (65.6%, a difference of 0.060%), German (65.6%, a difference of 0.060%), and Hungarian (65.6%, a difference of 0.070%).
| Demographics | Rating | Rank | College, Under 1 year |
| Immigrants | Uzbekistan | 61.6 /100 | #165 | Good 65.8% |
| Moroccans | 56.7 /100 | #166 | Average 65.6% |
| Immigrants | Somalia | 56.4 /100 | #167 | Average 65.6% |
| Hungarians | 55.9 /100 | #168 | Average 65.6% |
| Yugoslavians | 55.7 /100 | #169 | Average 65.6% |
| Germans | 55.7 /100 | #170 | Average 65.6% |
| Immigrants | Oceania | 55.0 /100 | #171 | Average 65.6% |
| South American Indians | 54.4 /100 | #172 | Average 65.5% |
| Swiss | 53.9 /100 | #173 | Average 65.5% |
| Immigrants | Bosnia and Herzegovina | 50.0 /100 | #174 | Average 65.4% |
| Scotch-Irish | 49.5 /100 | #175 | Average 65.4% |
| French | 48.9 /100 | #176 | Average 65.4% |
| Immigrants | North Macedonia | 48.6 /100 | #177 | Average 65.4% |
| German Russians | 48.3 /100 | #178 | Average 65.4% |
| Guamanians/Chamorros | 48.2 /100 | #179 | Average 65.4% |