Senegalese vs South American Indian Hearing Disability
COMPARE
Senegalese
South American Indian
Hearing Disability
Hearing Disability Comparison
Senegalese
South American Indians
2.6%
HEARING DISABILITY
99.4/ 100
METRIC RATING
43rd/ 347
METRIC RANK
2.9%
HEARING DISABILITY
86.9/ 100
METRIC RATING
127th/ 347
METRIC RANK
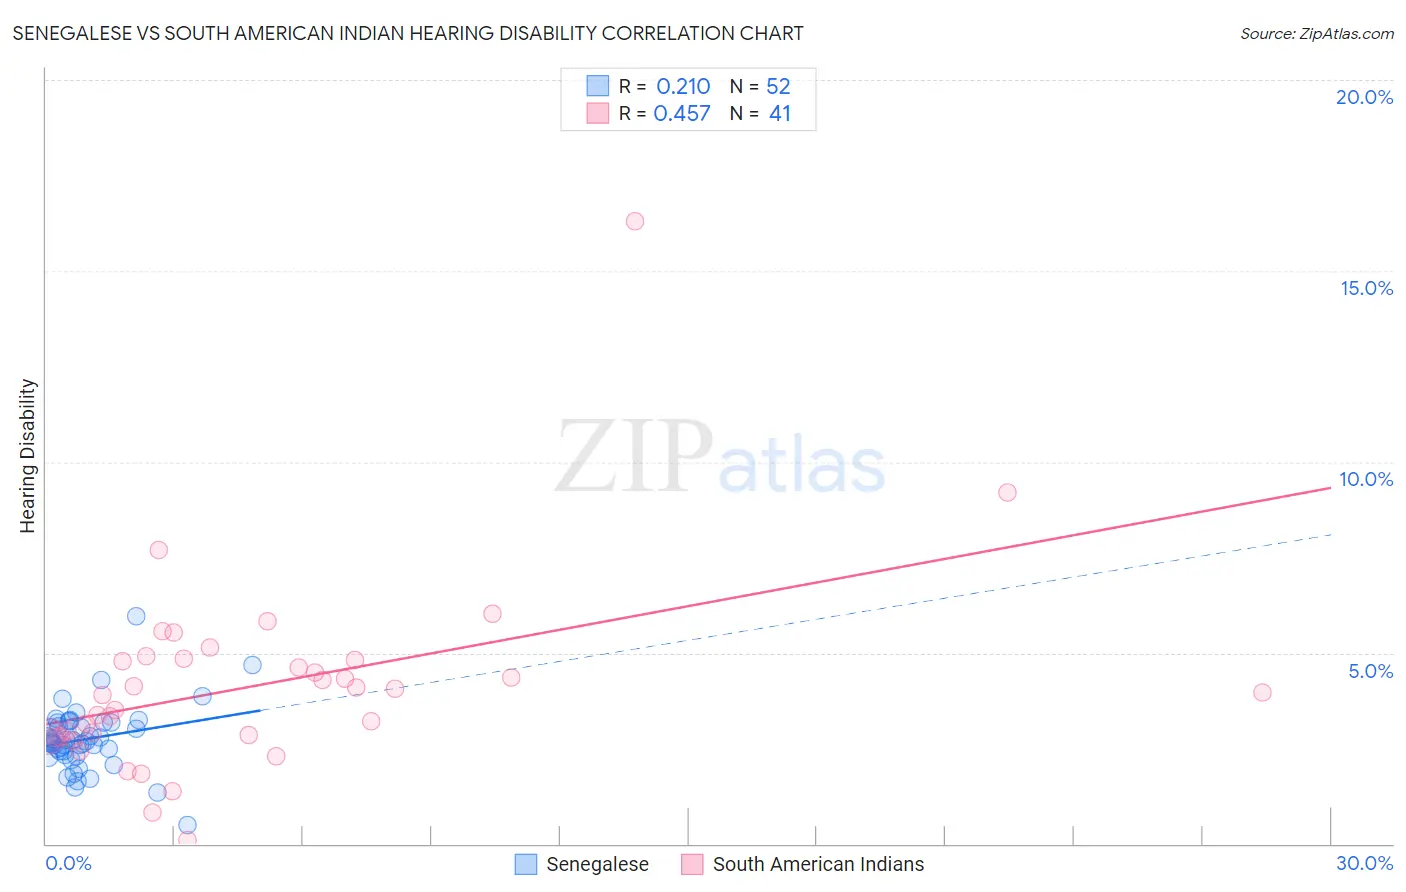
Senegalese vs South American Indian Hearing Disability Correlation Chart
The statistical analysis conducted on geographies consisting of 78,133,059 people shows a weak positive correlation between the proportion of Senegalese and percentage of population with hearing disability in the United States with a correlation coefficient (R) of 0.210 and weighted average of 2.6%. Similarly, the statistical analysis conducted on geographies consisting of 164,558,216 people shows a moderate positive correlation between the proportion of South American Indians and percentage of population with hearing disability in the United States with a correlation coefficient (R) of 0.457 and weighted average of 2.9%, a difference of 8.6%.
Hearing Disability Correlation Summary
| Measurement | Senegalese | South American Indian |
| Minimum | 0.50% | 0.098% |
| Maximum | 6.0% | 16.3% |
| Range | 5.5% | 16.2% |
| Mean | 2.7% | 4.1% |
| Median | 2.7% | 4.0% |
| Interquartile 25% (IQ1) | 2.4% | 2.8% |
| Interquartile 75% (IQ3) | 3.2% | 4.8% |
| Interquartile Range (IQR) | 0.80% | 2.0% |
| Standard Deviation (Sample) | 0.85% | 2.6% |
| Standard Deviation (Population) | 0.84% | 2.6% |
Similar Demographics by Hearing Disability
Demographics Similar to Senegalese by Hearing Disability
In terms of hearing disability, the demographic groups most similar to Senegalese are Immigrants from Taiwan (2.6%, a difference of 0.010%), West Indian (2.6%, a difference of 0.010%), Nigerian (2.6%, a difference of 0.22%), Venezuelan (2.6%, a difference of 0.25%), and Haitian (2.6%, a difference of 0.35%).
| Demographics | Rating | Rank | Hearing Disability |
| Okinawans | 99.6 /100 | #36 | Exceptional 2.6% |
| Immigrants | Western Africa | 99.6 /100 | #37 | Exceptional 2.6% |
| Immigrants | Jamaica | 99.5 /100 | #38 | Exceptional 2.6% |
| Immigrants | China | 99.5 /100 | #39 | Exceptional 2.6% |
| Haitians | 99.5 /100 | #40 | Exceptional 2.6% |
| Immigrants | Taiwan | 99.4 /100 | #41 | Exceptional 2.6% |
| West Indians | 99.4 /100 | #42 | Exceptional 2.6% |
| Senegalese | 99.4 /100 | #43 | Exceptional 2.6% |
| Nigerians | 99.4 /100 | #44 | Exceptional 2.6% |
| Venezuelans | 99.4 /100 | #45 | Exceptional 2.6% |
| Immigrants | Dominica | 99.3 /100 | #46 | Exceptional 2.6% |
| Immigrants | Israel | 99.3 /100 | #47 | Exceptional 2.6% |
| Immigrants | Singapore | 99.3 /100 | #48 | Exceptional 2.6% |
| Immigrants | South America | 99.2 /100 | #49 | Exceptional 2.7% |
| Paraguayans | 99.2 /100 | #50 | Exceptional 2.7% |
Demographics Similar to South American Indians by Hearing Disability
In terms of hearing disability, the demographic groups most similar to South American Indians are Immigrants from Western Asia (2.9%, a difference of 0.0%), Immigrants from Uganda (2.9%, a difference of 0.050%), Immigrants from Vietnam (2.9%, a difference of 0.070%), Immigrants from Kenya (2.9%, a difference of 0.16%), and Chilean (2.9%, a difference of 0.21%).
| Demographics | Rating | Rank | Hearing Disability |
| Jordanians | 89.5 /100 | #120 | Excellent 2.8% |
| Cubans | 89.4 /100 | #121 | Excellent 2.8% |
| Liberians | 89.0 /100 | #122 | Excellent 2.8% |
| Immigrants | Zaire | 88.6 /100 | #123 | Excellent 2.9% |
| Bahamians | 88.6 /100 | #124 | Excellent 2.9% |
| Immigrants | Albania | 88.5 /100 | #125 | Excellent 2.9% |
| Immigrants | Sudan | 87.8 /100 | #126 | Excellent 2.9% |
| South American Indians | 86.9 /100 | #127 | Excellent 2.9% |
| Immigrants | Western Asia | 86.9 /100 | #128 | Excellent 2.9% |
| Immigrants | Uganda | 86.6 /100 | #129 | Excellent 2.9% |
| Immigrants | Vietnam | 86.5 /100 | #130 | Excellent 2.9% |
| Immigrants | Kenya | 86.1 /100 | #131 | Excellent 2.9% |
| Chileans | 85.8 /100 | #132 | Excellent 2.9% |
| Immigrants | Syria | 85.8 /100 | #133 | Excellent 2.9% |
| Ugandans | 85.5 /100 | #134 | Excellent 2.9% |