Nepalese vs South American Indian 9th Grade
COMPARE
Nepalese
South American Indian
9th Grade
9th Grade Comparison
Nepalese
South American Indians
92.0%
9TH GRADE
0.0/ 100
METRIC RATING
318th/ 347
METRIC RANK
94.3%
9TH GRADE
2.8/ 100
METRIC RATING
238th/ 347
METRIC RANK
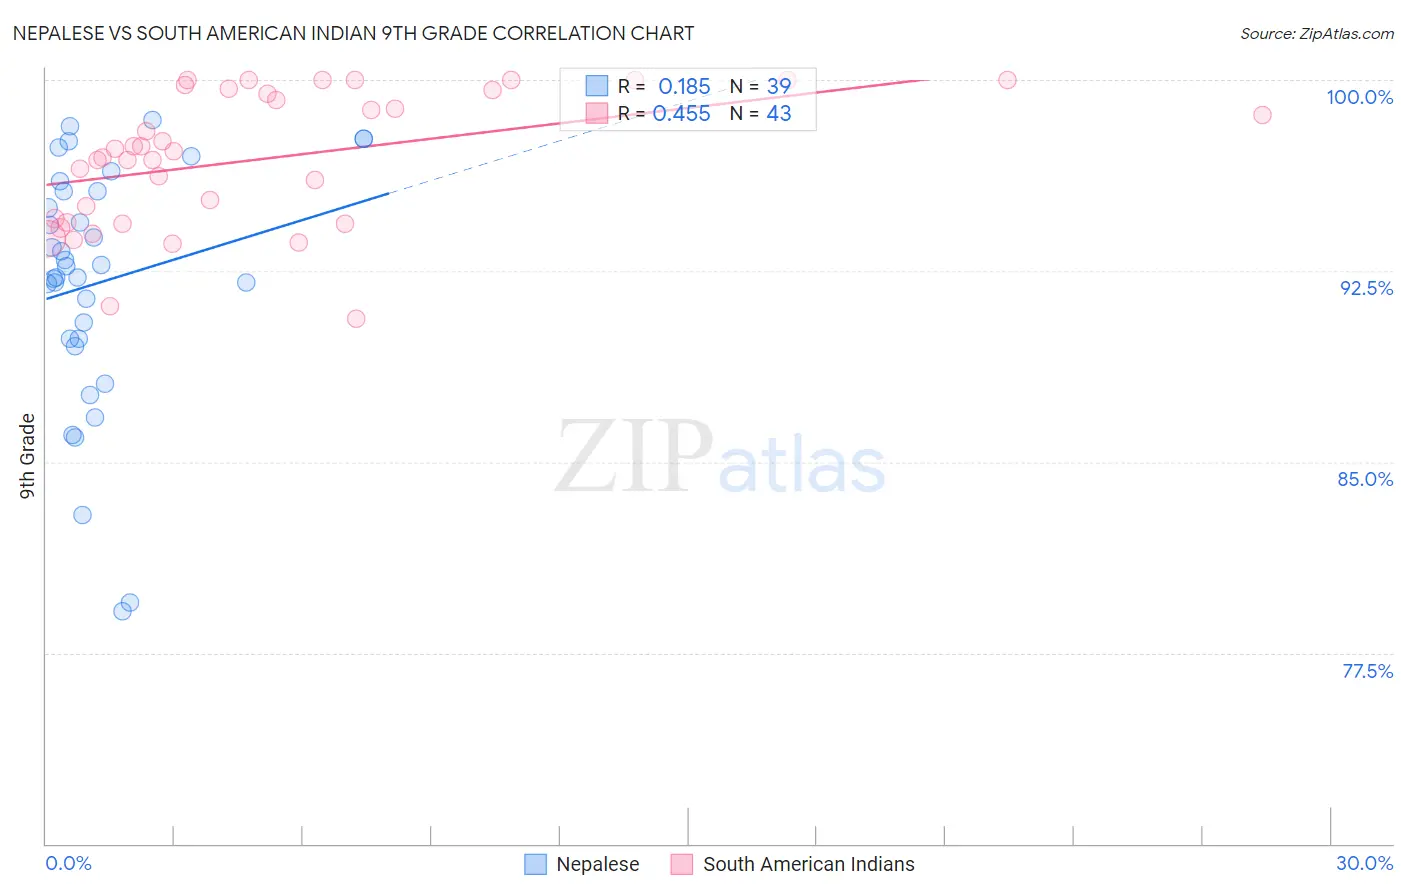
Nepalese vs South American Indian 9th Grade Correlation Chart
The statistical analysis conducted on geographies consisting of 24,519,269 people shows a poor positive correlation between the proportion of Nepalese and percentage of population with at least 9th grade education in the United States with a correlation coefficient (R) of 0.185 and weighted average of 92.0%. Similarly, the statistical analysis conducted on geographies consisting of 164,573,401 people shows a moderate positive correlation between the proportion of South American Indians and percentage of population with at least 9th grade education in the United States with a correlation coefficient (R) of 0.455 and weighted average of 94.3%, a difference of 2.5%.
9th Grade Correlation Summary
| Measurement | Nepalese | South American Indian |
| Minimum | 79.1% | 90.6% |
| Maximum | 98.4% | 100.0% |
| Range | 19.3% | 9.4% |
| Mean | 92.1% | 96.9% |
| Median | 92.7% | 97.2% |
| Interquartile 25% (IQ1) | 89.8% | 94.4% |
| Interquartile 75% (IQ3) | 95.6% | 99.6% |
| Interquartile Range (IQR) | 5.8% | 5.2% |
| Standard Deviation (Sample) | 4.8% | 2.6% |
| Standard Deviation (Population) | 4.7% | 2.6% |
Similar Demographics by 9th Grade
Demographics Similar to Nepalese by 9th Grade
In terms of 9th grade, the demographic groups most similar to Nepalese are Ecuadorian (91.9%, a difference of 0.050%), Nicaraguan (91.9%, a difference of 0.090%), Immigrants from Ecuador (91.8%, a difference of 0.16%), Belizean (91.8%, a difference of 0.19%), and Puerto Rican (91.8%, a difference of 0.19%).
| Demographics | Rating | Rank | 9th Grade |
| Immigrants | Fiji | 0.0 /100 | #311 | Tragic 92.3% |
| Houma | 0.0 /100 | #312 | Tragic 92.3% |
| Vietnamese | 0.0 /100 | #313 | Tragic 92.3% |
| Immigrants | Portugal | 0.0 /100 | #314 | Tragic 92.2% |
| Immigrants | Caribbean | 0.0 /100 | #315 | Tragic 92.2% |
| Cape Verdeans | 0.0 /100 | #316 | Tragic 92.2% |
| Immigrants | Cuba | 0.0 /100 | #317 | Tragic 92.2% |
| Nepalese | 0.0 /100 | #318 | Tragic 92.0% |
| Ecuadorians | 0.0 /100 | #319 | Tragic 91.9% |
| Nicaraguans | 0.0 /100 | #320 | Tragic 91.9% |
| Immigrants | Ecuador | 0.0 /100 | #321 | Tragic 91.8% |
| Belizeans | 0.0 /100 | #322 | Tragic 91.8% |
| Puerto Ricans | 0.0 /100 | #323 | Tragic 91.8% |
| Immigrants | Belize | 0.0 /100 | #324 | Tragic 91.8% |
| Central American Indians | 0.0 /100 | #325 | Tragic 91.5% |
Demographics Similar to South American Indians by 9th Grade
In terms of 9th grade, the demographic groups most similar to South American Indians are Korean (94.3%, a difference of 0.0%), Immigrants from China (94.3%, a difference of 0.0%), Somali (94.3%, a difference of 0.010%), Immigrants from Ethiopia (94.3%, a difference of 0.010%), and Spanish American (94.2%, a difference of 0.010%).
| Demographics | Rating | Rank | 9th Grade |
| Immigrants | Panama | 4.0 /100 | #231 | Tragic 94.3% |
| Immigrants | Africa | 3.9 /100 | #232 | Tragic 94.3% |
| Nigerians | 3.7 /100 | #233 | Tragic 94.3% |
| Costa Ricans | 3.5 /100 | #234 | Tragic 94.3% |
| Bolivians | 3.3 /100 | #235 | Tragic 94.3% |
| Somalis | 2.9 /100 | #236 | Tragic 94.3% |
| Koreans | 2.9 /100 | #237 | Tragic 94.3% |
| South American Indians | 2.8 /100 | #238 | Tragic 94.3% |
| Immigrants | China | 2.8 /100 | #239 | Tragic 94.3% |
| Immigrants | Ethiopia | 2.7 /100 | #240 | Tragic 94.3% |
| Spanish Americans | 2.6 /100 | #241 | Tragic 94.2% |
| Immigrants | Middle Africa | 2.2 /100 | #242 | Tragic 94.2% |
| Immigrants | Cameroon | 2.1 /100 | #243 | Tragic 94.2% |
| Dutch West Indians | 2.0 /100 | #244 | Tragic 94.2% |
| Paiute | 1.9 /100 | #245 | Tragic 94.2% |