Navajo vs Alsatian 1 or more Vehicles in Household
COMPARE
Navajo
Alsatian
1 or more Vehicles in Household
1 or more Vehicles in Household Comparison
Navajo
Alsatians
90.8%
1 OR MORE VEHICLES IN HOUSEHOLD
95.8/ 100
METRIC RATING
111th/ 347
METRIC RANK
87.1%
1 OR MORE VEHICLES IN HOUSEHOLD
0.1/ 100
METRIC RATING
277th/ 347
METRIC RANK
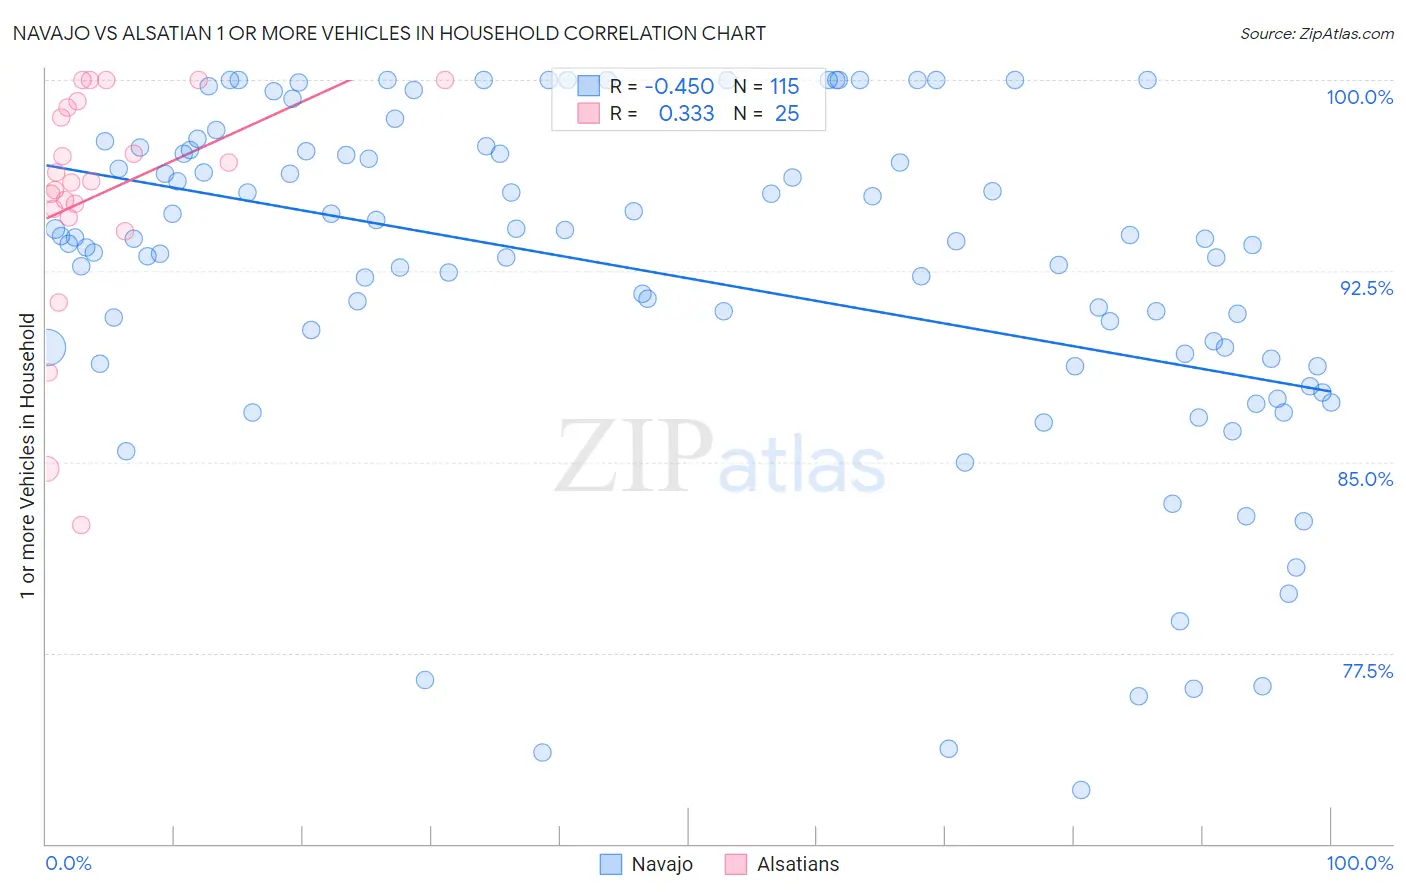
Navajo vs Alsatian 1 or more Vehicles in Household Correlation Chart
The statistical analysis conducted on geographies consisting of 224,767,823 people shows a moderate negative correlation between the proportion of Navajo and percentage of households with 1 or more vehicles available in the United States with a correlation coefficient (R) of -0.450 and weighted average of 90.8%. Similarly, the statistical analysis conducted on geographies consisting of 82,680,020 people shows a mild positive correlation between the proportion of Alsatians and percentage of households with 1 or more vehicles available in the United States with a correlation coefficient (R) of 0.333 and weighted average of 87.1%, a difference of 4.2%.
1 or more Vehicles in Household Correlation Summary
| Measurement | Navajo | Alsatian |
| Minimum | 72.1% | 82.5% |
| Maximum | 100.0% | 100.0% |
| Range | 27.9% | 17.5% |
| Mean | 92.4% | 95.5% |
| Median | 93.7% | 96.0% |
| Interquartile 25% (IQ1) | 89.1% | 94.8% |
| Interquartile 75% (IQ3) | 97.2% | 99.0% |
| Interquartile Range (IQR) | 8.2% | 4.3% |
| Standard Deviation (Sample) | 6.7% | 4.6% |
| Standard Deviation (Population) | 6.7% | 4.5% |
Similar Demographics by 1 or more Vehicles in Household
Demographics Similar to Navajo by 1 or more Vehicles in Household
In terms of 1 or more vehicles in household, the demographic groups most similar to Navajo are Immigrants from Netherlands (90.8%, a difference of 0.010%), Immigrants from Kuwait (90.7%, a difference of 0.090%), Armenian (90.7%, a difference of 0.11%), Serbian (90.7%, a difference of 0.12%), and Chippewa (90.7%, a difference of 0.13%).
| Demographics | Rating | Rank | 1 or more Vehicles in Household |
| Asians | 98.2 /100 | #104 | Exceptional 91.1% |
| Laotians | 98.0 /100 | #105 | Exceptional 91.0% |
| Zimbabweans | 97.7 /100 | #106 | Exceptional 91.0% |
| Maltese | 97.7 /100 | #107 | Exceptional 91.0% |
| Hispanics or Latinos | 97.6 /100 | #108 | Exceptional 91.0% |
| Delaware | 97.6 /100 | #109 | Exceptional 91.0% |
| Mexican American Indians | 97.4 /100 | #110 | Exceptional 91.0% |
| Navajo | 95.8 /100 | #111 | Exceptional 90.8% |
| Immigrants | Netherlands | 95.7 /100 | #112 | Exceptional 90.8% |
| Immigrants | Kuwait | 94.7 /100 | #113 | Exceptional 90.7% |
| Armenians | 94.5 /100 | #114 | Exceptional 90.7% |
| Serbians | 94.3 /100 | #115 | Exceptional 90.7% |
| Chippewa | 94.3 /100 | #116 | Exceptional 90.7% |
| Greeks | 93.5 /100 | #117 | Exceptional 90.6% |
| Japanese | 93.4 /100 | #118 | Exceptional 90.6% |
Demographics Similar to Alsatians by 1 or more Vehicles in Household
In terms of 1 or more vehicles in household, the demographic groups most similar to Alsatians are Immigrants from Southern Europe (87.1%, a difference of 0.040%), Immigrants from Albania (87.1%, a difference of 0.040%), Immigrants from France (87.1%, a difference of 0.060%), Immigrants from Croatia (87.0%, a difference of 0.070%), and Immigrants from Singapore (87.2%, a difference of 0.13%).
| Demographics | Rating | Rank | 1 or more Vehicles in Household |
| Panamanians | 0.2 /100 | #270 | Tragic 87.5% |
| Bermudans | 0.2 /100 | #271 | Tragic 87.5% |
| Aleuts | 0.2 /100 | #272 | Tragic 87.5% |
| Immigrants | Northern Africa | 0.2 /100 | #273 | Tragic 87.4% |
| Immigrants | Morocco | 0.1 /100 | #274 | Tragic 87.4% |
| Immigrants | Singapore | 0.1 /100 | #275 | Tragic 87.2% |
| Immigrants | France | 0.1 /100 | #276 | Tragic 87.1% |
| Alsatians | 0.1 /100 | #277 | Tragic 87.1% |
| Immigrants | Southern Europe | 0.1 /100 | #278 | Tragic 87.1% |
| Immigrants | Albania | 0.1 /100 | #279 | Tragic 87.1% |
| Immigrants | Croatia | 0.0 /100 | #280 | Tragic 87.0% |
| Mongolians | 0.0 /100 | #281 | Tragic 87.0% |
| Colville | 0.0 /100 | #282 | Tragic 86.8% |
| Immigrants | Eastern Europe | 0.0 /100 | #283 | Tragic 86.7% |
| Central American Indians | 0.0 /100 | #284 | Tragic 86.7% |