Central American vs Alsatian Male Disability
COMPARE
Central American
Alsatian
Male Disability
Male Disability Comparison
Central Americans
Alsatians
10.8%
MALE DISABILITY
92.7/ 100
METRIC RATING
114th/ 347
METRIC RANK
11.7%
MALE DISABILITY
3.3/ 100
METRIC RATING
222nd/ 347
METRIC RANK
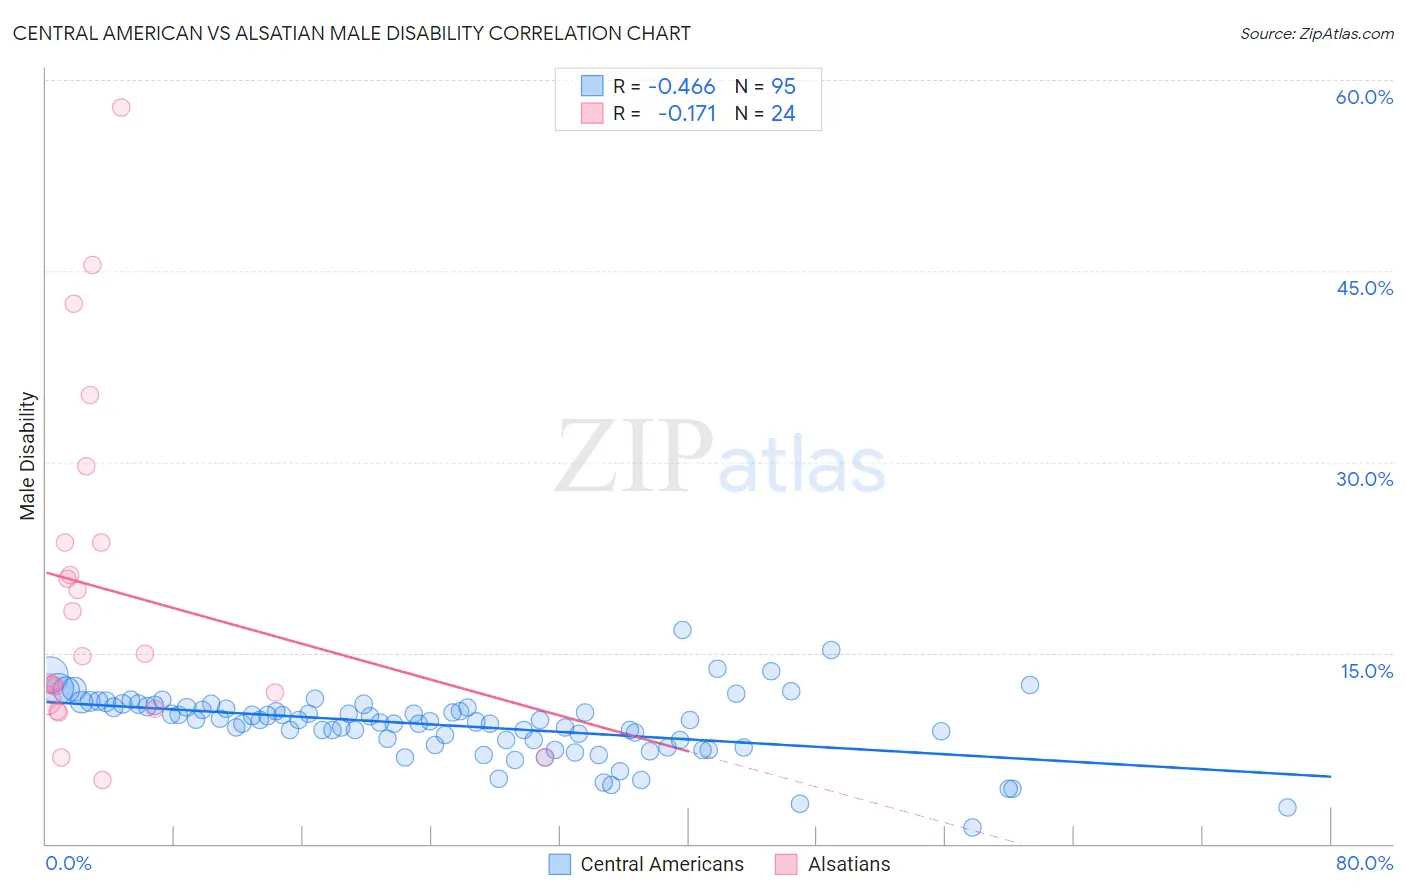
Central American vs Alsatian Male Disability Correlation Chart
The statistical analysis conducted on geographies consisting of 504,432,725 people shows a moderate negative correlation between the proportion of Central Americans and percentage of males with a disability in the United States with a correlation coefficient (R) of -0.466 and weighted average of 10.8%. Similarly, the statistical analysis conducted on geographies consisting of 82,682,247 people shows a poor negative correlation between the proportion of Alsatians and percentage of males with a disability in the United States with a correlation coefficient (R) of -0.171 and weighted average of 11.7%, a difference of 8.5%.
Male Disability Correlation Summary
| Measurement | Central American | Alsatian |
| Minimum | 1.3% | 5.0% |
| Maximum | 16.7% | 57.8% |
| Range | 15.5% | 52.8% |
| Mean | 9.3% | 19.9% |
| Median | 9.7% | 14.9% |
| Interquartile 25% (IQ1) | 8.1% | 10.9% |
| Interquartile 75% (IQ3) | 10.8% | 23.6% |
| Interquartile Range (IQR) | 2.7% | 12.7% |
| Standard Deviation (Sample) | 2.5% | 13.4% |
| Standard Deviation (Population) | 2.5% | 13.1% |
Similar Demographics by Male Disability
Demographics Similar to Central Americans by Male Disability
In terms of male disability, the demographic groups most similar to Central Americans are Immigrants from Zimbabwe (10.8%, a difference of 0.070%), Immigrants from Barbados (10.8%, a difference of 0.10%), Ghanaian (10.8%, a difference of 0.15%), Immigrants from South Africa (10.8%, a difference of 0.17%), and Immigrants from Uruguay (10.8%, a difference of 0.25%).
| Demographics | Rating | Rank | Male Disability |
| Immigrants | Eastern Africa | 94.3 /100 | #107 | Exceptional 10.8% |
| Immigrants | Belgium | 94.2 /100 | #108 | Exceptional 10.8% |
| Immigrants | Uganda | 94.0 /100 | #109 | Exceptional 10.8% |
| Immigrants | Immigrants | 93.9 /100 | #110 | Exceptional 10.8% |
| Immigrants | Uruguay | 93.8 /100 | #111 | Exceptional 10.8% |
| Ghanaians | 93.4 /100 | #112 | Exceptional 10.8% |
| Immigrants | Zimbabwe | 93.0 /100 | #113 | Exceptional 10.8% |
| Central Americans | 92.7 /100 | #114 | Exceptional 10.8% |
| Immigrants | Barbados | 92.2 /100 | #115 | Exceptional 10.8% |
| Immigrants | South Africa | 91.8 /100 | #116 | Exceptional 10.8% |
| Eastern Europeans | 90.6 /100 | #117 | Exceptional 10.9% |
| Immigrants | Cuba | 90.2 /100 | #118 | Exceptional 10.9% |
| Armenians | 90.1 /100 | #119 | Exceptional 10.9% |
| Immigrants | Africa | 89.4 /100 | #120 | Excellent 10.9% |
| Immigrants | South Eastern Asia | 89.2 /100 | #121 | Excellent 10.9% |
Demographics Similar to Alsatians by Male Disability
In terms of male disability, the demographic groups most similar to Alsatians are Immigrants from Bahamas (11.7%, a difference of 0.080%), Japanese (11.7%, a difference of 0.11%), Liberian (11.8%, a difference of 0.12%), Immigrants from Congo (11.7%, a difference of 0.15%), and Panamanian (11.7%, a difference of 0.17%).
| Demographics | Rating | Rank | Male Disability |
| Indonesians | 5.9 /100 | #215 | Tragic 11.6% |
| Immigrants | Dominican Republic | 4.9 /100 | #216 | Tragic 11.7% |
| Immigrants | Dominica | 4.6 /100 | #217 | Tragic 11.7% |
| Immigrants | England | 4.0 /100 | #218 | Tragic 11.7% |
| Panamanians | 3.8 /100 | #219 | Tragic 11.7% |
| Immigrants | Western Europe | 3.8 /100 | #220 | Tragic 11.7% |
| Immigrants | Congo | 3.7 /100 | #221 | Tragic 11.7% |
| Alsatians | 3.3 /100 | #222 | Tragic 11.7% |
| Immigrants | Bahamas | 3.2 /100 | #223 | Tragic 11.7% |
| Japanese | 3.1 /100 | #224 | Tragic 11.7% |
| Liberians | 3.1 /100 | #225 | Tragic 11.8% |
| Sub-Saharan Africans | 2.8 /100 | #226 | Tragic 11.8% |
| Austrians | 2.5 /100 | #227 | Tragic 11.8% |
| Hispanics or Latinos | 2.3 /100 | #228 | Tragic 11.8% |
| Bermudans | 2.3 /100 | #229 | Tragic 11.8% |