Creek vs Alsatian Male Disability
COMPARE
Creek
Alsatian
Male Disability
Male Disability Comparison
Creek
Alsatians
15.5%
MALE DISABILITY
0.0/ 100
METRIC RATING
343rd/ 347
METRIC RANK
11.7%
MALE DISABILITY
3.3/ 100
METRIC RATING
222nd/ 347
METRIC RANK
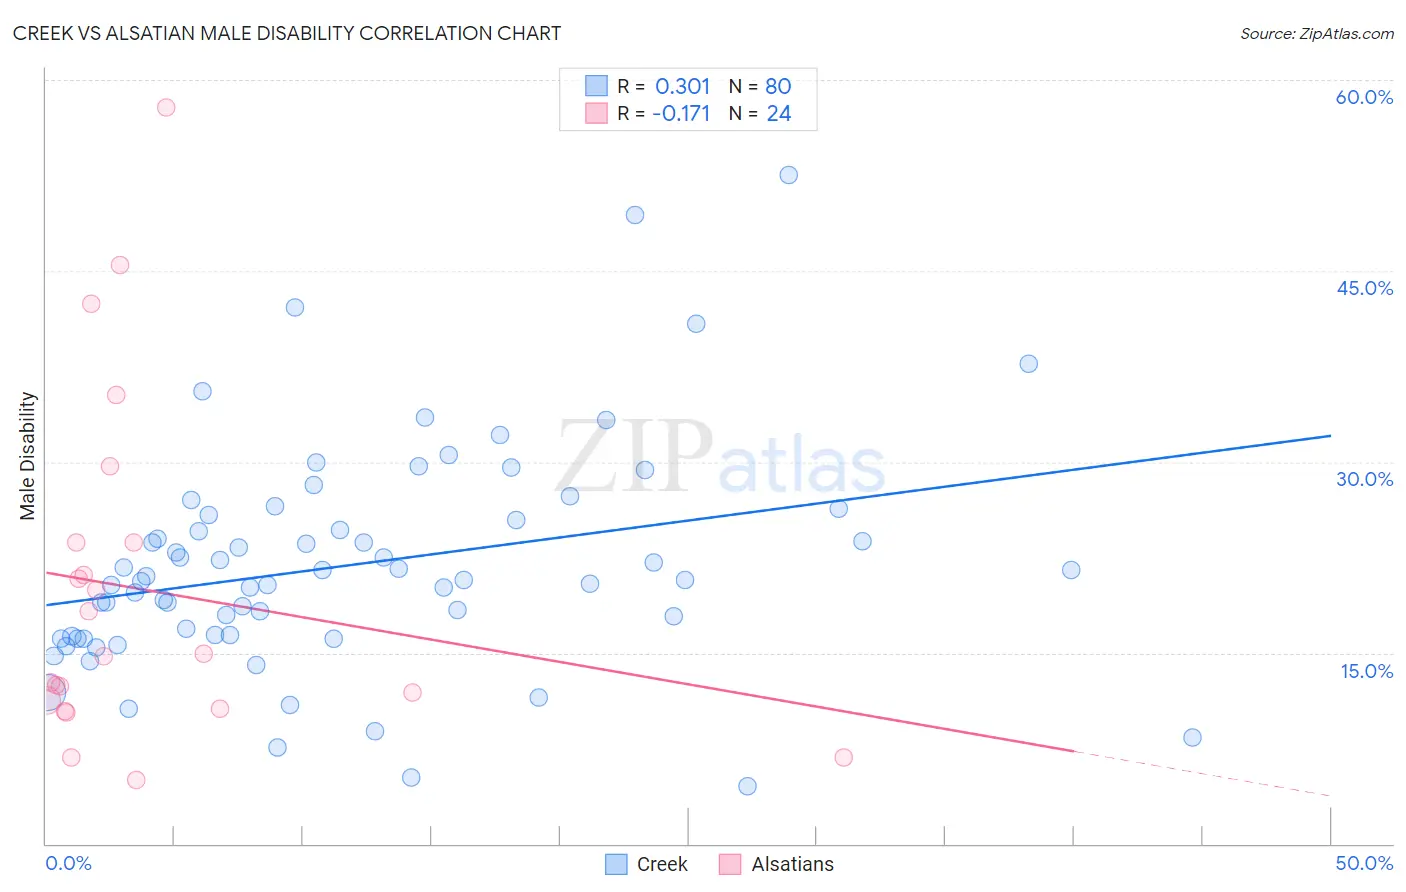
Creek vs Alsatian Male Disability Correlation Chart
The statistical analysis conducted on geographies consisting of 178,460,797 people shows a mild positive correlation between the proportion of Creek and percentage of males with a disability in the United States with a correlation coefficient (R) of 0.301 and weighted average of 15.5%. Similarly, the statistical analysis conducted on geographies consisting of 82,682,247 people shows a poor negative correlation between the proportion of Alsatians and percentage of males with a disability in the United States with a correlation coefficient (R) of -0.171 and weighted average of 11.7%, a difference of 32.3%.
Male Disability Correlation Summary
| Measurement | Creek | Alsatian |
| Minimum | 4.5% | 5.0% |
| Maximum | 52.5% | 57.8% |
| Range | 48.1% | 52.8% |
| Mean | 21.9% | 19.9% |
| Median | 20.7% | 14.9% |
| Interquartile 25% (IQ1) | 16.3% | 10.9% |
| Interquartile 75% (IQ3) | 25.6% | 23.6% |
| Interquartile Range (IQR) | 9.3% | 12.7% |
| Standard Deviation (Sample) | 8.7% | 13.4% |
| Standard Deviation (Population) | 8.7% | 13.1% |
Similar Demographics by Male Disability
Demographics Similar to Creek by Male Disability
In terms of male disability, the demographic groups most similar to Creek are Puerto Rican (15.6%, a difference of 0.13%), Tsimshian (15.6%, a difference of 0.45%), Kiowa (15.4%, a difference of 0.66%), Choctaw (15.4%, a difference of 0.85%), and Lumbee (15.2%, a difference of 2.0%).
| Demographics | Rating | Rank | Male Disability |
| Yuman | 0.0 /100 | #333 | Tragic 14.7% |
| Cherokee | 0.0 /100 | #334 | Tragic 14.8% |
| Dutch West Indians | 0.0 /100 | #335 | Tragic 14.8% |
| Alaskan Athabascans | 0.0 /100 | #336 | Tragic 14.9% |
| Menominee | 0.0 /100 | #337 | Tragic 15.0% |
| Pueblo | 0.0 /100 | #338 | Tragic 15.0% |
| Chickasaw | 0.0 /100 | #339 | Tragic 15.1% |
| Lumbee | 0.0 /100 | #340 | Tragic 15.2% |
| Choctaw | 0.0 /100 | #341 | Tragic 15.4% |
| Kiowa | 0.0 /100 | #342 | Tragic 15.4% |
| Creek | 0.0 /100 | #343 | Tragic 15.5% |
| Puerto Ricans | 0.0 /100 | #344 | Tragic 15.6% |
| Tsimshian | 0.0 /100 | #345 | Tragic 15.6% |
| Colville | 0.0 /100 | #346 | Tragic 16.5% |
| Houma | 0.0 /100 | #347 | Tragic 17.4% |
Demographics Similar to Alsatians by Male Disability
In terms of male disability, the demographic groups most similar to Alsatians are Immigrants from Bahamas (11.7%, a difference of 0.080%), Japanese (11.7%, a difference of 0.11%), Liberian (11.8%, a difference of 0.12%), Immigrants from Congo (11.7%, a difference of 0.15%), and Panamanian (11.7%, a difference of 0.17%).
| Demographics | Rating | Rank | Male Disability |
| Indonesians | 5.9 /100 | #215 | Tragic 11.6% |
| Immigrants | Dominican Republic | 4.9 /100 | #216 | Tragic 11.7% |
| Immigrants | Dominica | 4.6 /100 | #217 | Tragic 11.7% |
| Immigrants | England | 4.0 /100 | #218 | Tragic 11.7% |
| Panamanians | 3.8 /100 | #219 | Tragic 11.7% |
| Immigrants | Western Europe | 3.8 /100 | #220 | Tragic 11.7% |
| Immigrants | Congo | 3.7 /100 | #221 | Tragic 11.7% |
| Alsatians | 3.3 /100 | #222 | Tragic 11.7% |
| Immigrants | Bahamas | 3.2 /100 | #223 | Tragic 11.7% |
| Japanese | 3.1 /100 | #224 | Tragic 11.7% |
| Liberians | 3.1 /100 | #225 | Tragic 11.8% |
| Sub-Saharan Africans | 2.8 /100 | #226 | Tragic 11.8% |
| Austrians | 2.5 /100 | #227 | Tragic 11.8% |
| Hispanics or Latinos | 2.3 /100 | #228 | Tragic 11.8% |
| Bermudans | 2.3 /100 | #229 | Tragic 11.8% |