Yakama vs Alsatian Male Disability
COMPARE
Yakama
Alsatian
Male Disability
Male Disability Comparison
Yakama
Alsatians
13.5%
MALE DISABILITY
0.0/ 100
METRIC RATING
312th/ 347
METRIC RANK
11.7%
MALE DISABILITY
3.3/ 100
METRIC RATING
222nd/ 347
METRIC RANK
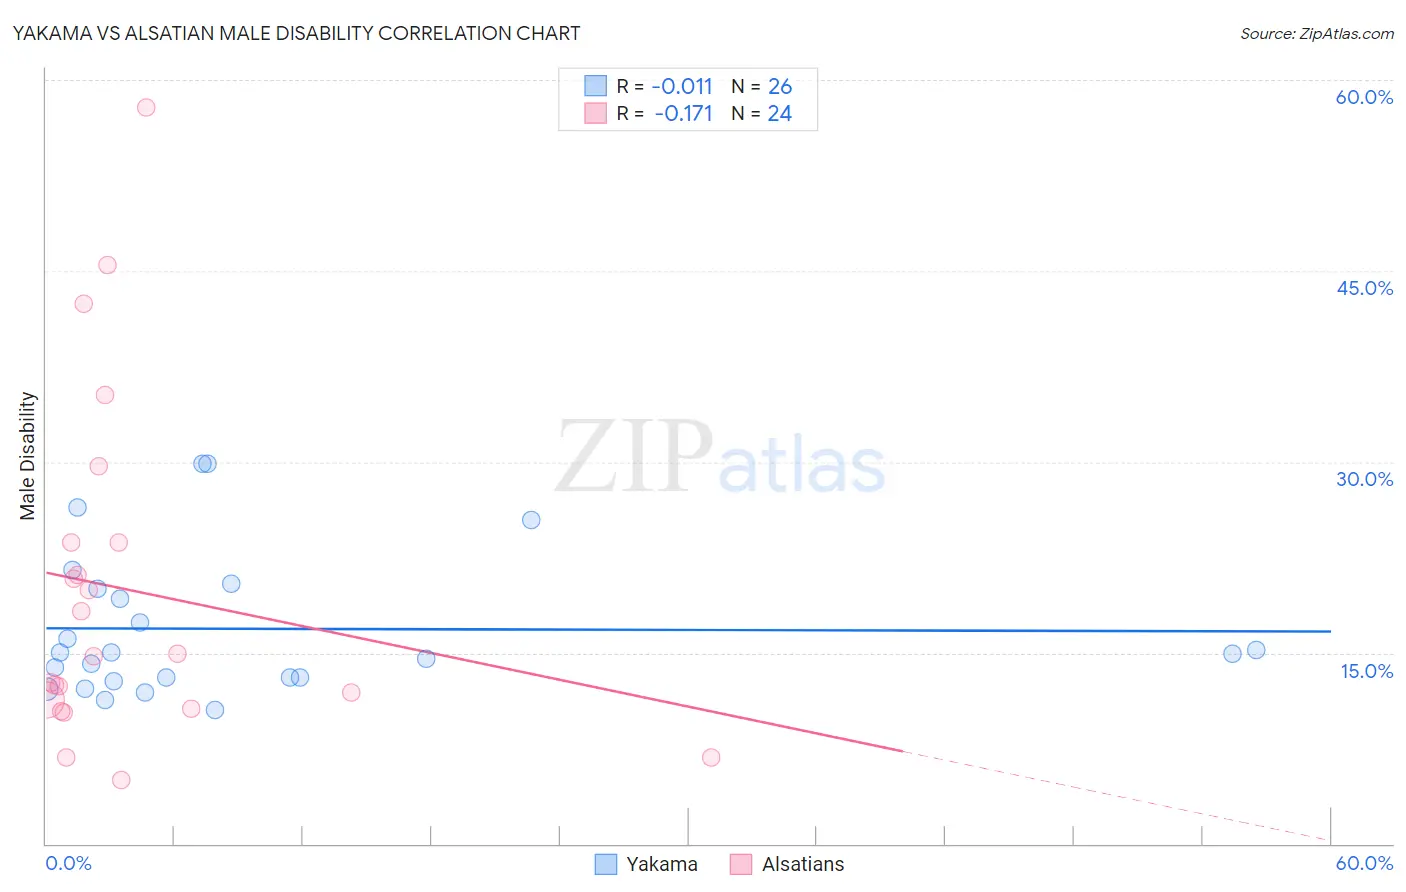
Yakama vs Alsatian Male Disability Correlation Chart
The statistical analysis conducted on geographies consisting of 19,917,759 people shows no correlation between the proportion of Yakama and percentage of males with a disability in the United States with a correlation coefficient (R) of -0.011 and weighted average of 13.5%. Similarly, the statistical analysis conducted on geographies consisting of 82,682,247 people shows a poor negative correlation between the proportion of Alsatians and percentage of males with a disability in the United States with a correlation coefficient (R) of -0.171 and weighted average of 11.7%, a difference of 15.3%.
Male Disability Correlation Summary
| Measurement | Yakama | Alsatian |
| Minimum | 10.5% | 5.0% |
| Maximum | 29.8% | 57.8% |
| Range | 19.4% | 52.8% |
| Mean | 16.9% | 19.9% |
| Median | 15.0% | 14.9% |
| Interquartile 25% (IQ1) | 13.0% | 10.9% |
| Interquartile 75% (IQ3) | 20.0% | 23.6% |
| Interquartile Range (IQR) | 7.0% | 12.7% |
| Standard Deviation (Sample) | 5.6% | 13.4% |
| Standard Deviation (Population) | 5.5% | 13.1% |
Similar Demographics by Male Disability
Demographics Similar to Yakama by Male Disability
In terms of male disability, the demographic groups most similar to Yakama are Puget Sound Salish (13.5%, a difference of 0.020%), Aleut (13.5%, a difference of 0.080%), Iroquois (13.6%, a difference of 0.24%), Alaska Native (13.6%, a difference of 0.29%), and Delaware (13.5%, a difference of 0.55%).
| Demographics | Rating | Rank | Male Disability |
| French Canadians | 0.0 /100 | #305 | Tragic 13.3% |
| Spanish Americans | 0.0 /100 | #306 | Tragic 13.3% |
| Arapaho | 0.0 /100 | #307 | Tragic 13.3% |
| French American Indians | 0.0 /100 | #308 | Tragic 13.4% |
| Blackfeet | 0.0 /100 | #309 | Tragic 13.4% |
| Immigrants | Azores | 0.0 /100 | #310 | Tragic 13.4% |
| Delaware | 0.0 /100 | #311 | Tragic 13.5% |
| Yakama | 0.0 /100 | #312 | Tragic 13.5% |
| Puget Sound Salish | 0.0 /100 | #313 | Tragic 13.5% |
| Aleuts | 0.0 /100 | #314 | Tragic 13.5% |
| Iroquois | 0.0 /100 | #315 | Tragic 13.6% |
| Alaska Natives | 0.0 /100 | #316 | Tragic 13.6% |
| Paiute | 0.0 /100 | #317 | Tragic 13.7% |
| Cree | 0.0 /100 | #318 | Tragic 13.7% |
| Americans | 0.0 /100 | #319 | Tragic 13.8% |
Demographics Similar to Alsatians by Male Disability
In terms of male disability, the demographic groups most similar to Alsatians are Immigrants from Bahamas (11.7%, a difference of 0.080%), Japanese (11.7%, a difference of 0.11%), Liberian (11.8%, a difference of 0.12%), Immigrants from Congo (11.7%, a difference of 0.15%), and Panamanian (11.7%, a difference of 0.17%).
| Demographics | Rating | Rank | Male Disability |
| Indonesians | 5.9 /100 | #215 | Tragic 11.6% |
| Immigrants | Dominican Republic | 4.9 /100 | #216 | Tragic 11.7% |
| Immigrants | Dominica | 4.6 /100 | #217 | Tragic 11.7% |
| Immigrants | England | 4.0 /100 | #218 | Tragic 11.7% |
| Panamanians | 3.8 /100 | #219 | Tragic 11.7% |
| Immigrants | Western Europe | 3.8 /100 | #220 | Tragic 11.7% |
| Immigrants | Congo | 3.7 /100 | #221 | Tragic 11.7% |
| Alsatians | 3.3 /100 | #222 | Tragic 11.7% |
| Immigrants | Bahamas | 3.2 /100 | #223 | Tragic 11.7% |
| Japanese | 3.1 /100 | #224 | Tragic 11.7% |
| Liberians | 3.1 /100 | #225 | Tragic 11.8% |
| Sub-Saharan Africans | 2.8 /100 | #226 | Tragic 11.8% |
| Austrians | 2.5 /100 | #227 | Tragic 11.8% |
| Hispanics or Latinos | 2.3 /100 | #228 | Tragic 11.8% |
| Bermudans | 2.3 /100 | #229 | Tragic 11.8% |