Nigerian vs Turkish Disability Age 35 to 64
COMPARE
Nigerian
Turkish
Disability Age 35 to 64
Disability Age 35 to 64 Comparison
Nigerians
Turks
11.6%
DISABILITY AGE 35 TO 64
16.3/ 100
METRIC RATING
204th/ 347
METRIC RANK
9.7%
DISABILITY AGE 35 TO 64
99.9/ 100
METRIC RATING
32nd/ 347
METRIC RANK
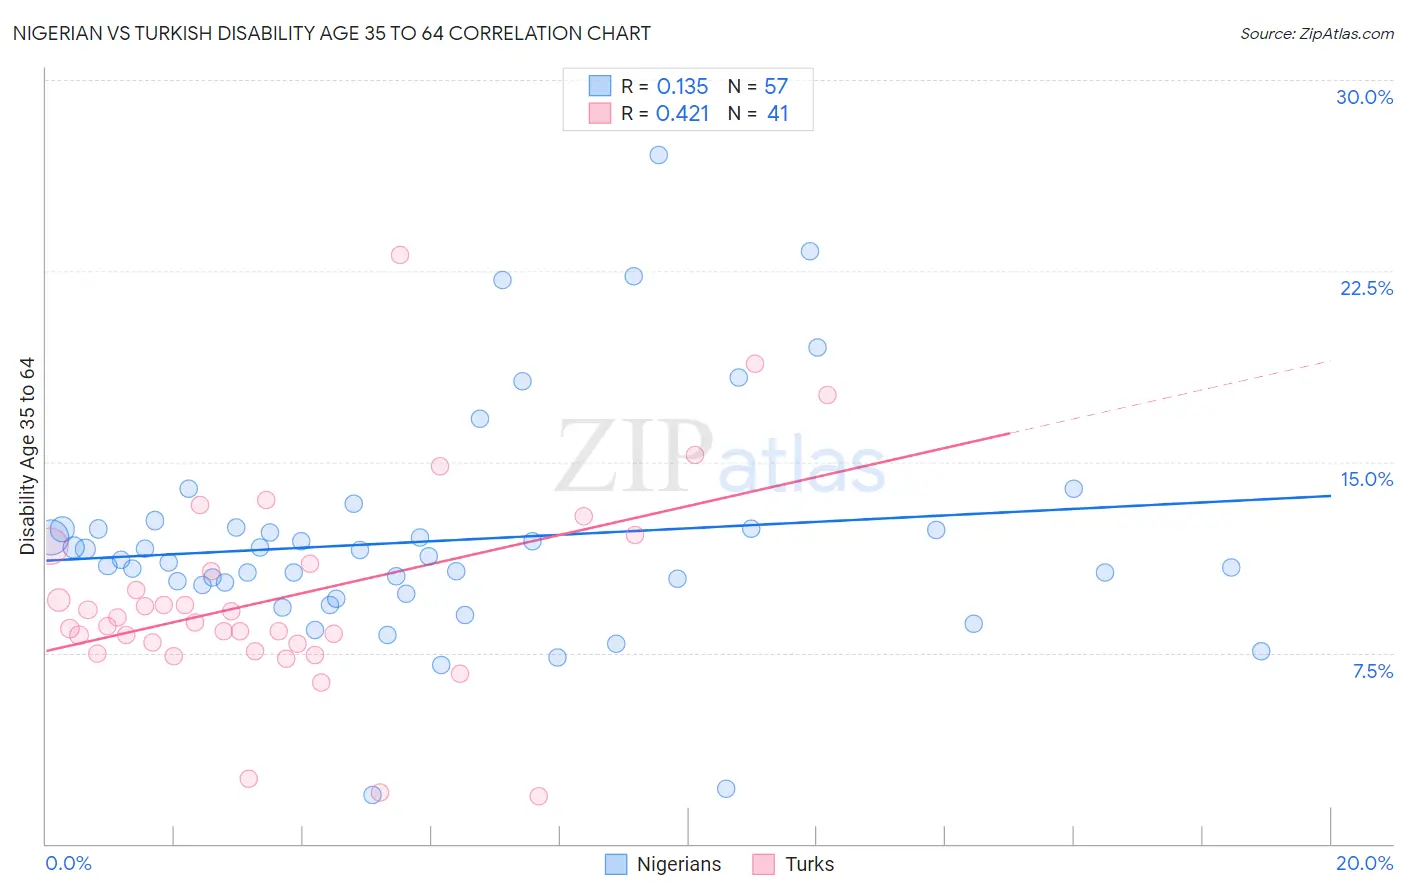
Nigerian vs Turkish Disability Age 35 to 64 Correlation Chart
The statistical analysis conducted on geographies consisting of 332,461,333 people shows a poor positive correlation between the proportion of Nigerians and percentage of population with a disability between the ages 34 and 64 in the United States with a correlation coefficient (R) of 0.135 and weighted average of 11.6%. Similarly, the statistical analysis conducted on geographies consisting of 271,671,610 people shows a moderate positive correlation between the proportion of Turks and percentage of population with a disability between the ages 34 and 64 in the United States with a correlation coefficient (R) of 0.421 and weighted average of 9.7%, a difference of 20.6%.
Disability Age 35 to 64 Correlation Summary
| Measurement | Nigerian | Turkish |
| Minimum | 1.9% | 1.9% |
| Maximum | 27.1% | 23.1% |
| Range | 25.2% | 21.2% |
| Mean | 11.9% | 9.7% |
| Median | 11.2% | 8.7% |
| Interquartile 25% (IQ1) | 10.0% | 7.7% |
| Interquartile 75% (IQ3) | 12.4% | 11.3% |
| Interquartile Range (IQR) | 2.4% | 3.6% |
| Standard Deviation (Sample) | 4.5% | 4.1% |
| Standard Deviation (Population) | 4.4% | 4.1% |
Similar Demographics by Disability Age 35 to 64
Demographics Similar to Nigerians by Disability Age 35 to 64
In terms of disability age 35 to 64, the demographic groups most similar to Nigerians are British (11.6%, a difference of 0.11%), Slavic (11.7%, a difference of 0.11%), Immigrants from Guatemala (11.6%, a difference of 0.17%), Immigrants from Kenya (11.6%, a difference of 0.20%), and Native Hawaiian (11.7%, a difference of 0.21%).
| Demographics | Rating | Rank | Disability Age 35 to 64 |
| Immigrants | Iraq | 21.0 /100 | #197 | Fair 11.6% |
| Immigrants | Panama | 20.4 /100 | #198 | Fair 11.6% |
| Basques | 19.5 /100 | #199 | Poor 11.6% |
| Swiss | 18.7 /100 | #200 | Poor 11.6% |
| Immigrants | Kenya | 17.7 /100 | #201 | Poor 11.6% |
| Immigrants | Guatemala | 17.5 /100 | #202 | Poor 11.6% |
| British | 17.0 /100 | #203 | Poor 11.6% |
| Nigerians | 16.3 /100 | #204 | Poor 11.6% |
| Slavs | 15.5 /100 | #205 | Poor 11.7% |
| Native Hawaiians | 14.8 /100 | #206 | Poor 11.7% |
| Ghanaians | 14.8 /100 | #207 | Poor 11.7% |
| Guatemalans | 14.6 /100 | #208 | Poor 11.7% |
| Europeans | 13.5 /100 | #209 | Poor 11.7% |
| Belgians | 13.1 /100 | #210 | Poor 11.7% |
| Canadians | 13.0 /100 | #211 | Poor 11.7% |
Demographics Similar to Turks by Disability Age 35 to 64
In terms of disability age 35 to 64, the demographic groups most similar to Turks are Immigrants from Indonesia (9.7%, a difference of 0.070%), Immigrants from Australia (9.7%, a difference of 0.15%), Bulgarian (9.7%, a difference of 0.25%), Immigrants from Cuba (9.7%, a difference of 0.28%), and Immigrants from Turkey (9.7%, a difference of 0.36%).
| Demographics | Rating | Rank | Disability Age 35 to 64 |
| Venezuelans | 100.0 /100 | #25 | Exceptional 9.4% |
| Immigrants | Sri Lanka | 100.0 /100 | #26 | Exceptional 9.5% |
| Immigrants | Asia | 100.0 /100 | #27 | Exceptional 9.5% |
| Immigrants | Pakistan | 100.0 /100 | #28 | Exceptional 9.5% |
| Immigrants | Ireland | 100.0 /100 | #29 | Exceptional 9.5% |
| Immigrants | Japan | 100.0 /100 | #30 | Exceptional 9.5% |
| Immigrants | Lithuania | 99.9 /100 | #31 | Exceptional 9.6% |
| Turks | 99.9 /100 | #32 | Exceptional 9.7% |
| Immigrants | Indonesia | 99.9 /100 | #33 | Exceptional 9.7% |
| Immigrants | Australia | 99.9 /100 | #34 | Exceptional 9.7% |
| Bulgarians | 99.9 /100 | #35 | Exceptional 9.7% |
| Immigrants | Cuba | 99.9 /100 | #36 | Exceptional 9.7% |
| Immigrants | Turkey | 99.9 /100 | #37 | Exceptional 9.7% |
| Egyptians | 99.9 /100 | #38 | Exceptional 9.7% |
| Immigrants | Belarus | 99.9 /100 | #39 | Exceptional 9.7% |