Immigrants from Scotland vs Turkish Disability Age 35 to 64
COMPARE
Immigrants from Scotland
Turkish
Disability Age 35 to 64
Disability Age 35 to 64 Comparison
Immigrants from Scotland
Turks
10.7%
DISABILITY AGE 35 TO 64
91.3/ 100
METRIC RATING
140th/ 347
METRIC RANK
9.7%
DISABILITY AGE 35 TO 64
99.9/ 100
METRIC RATING
32nd/ 347
METRIC RANK
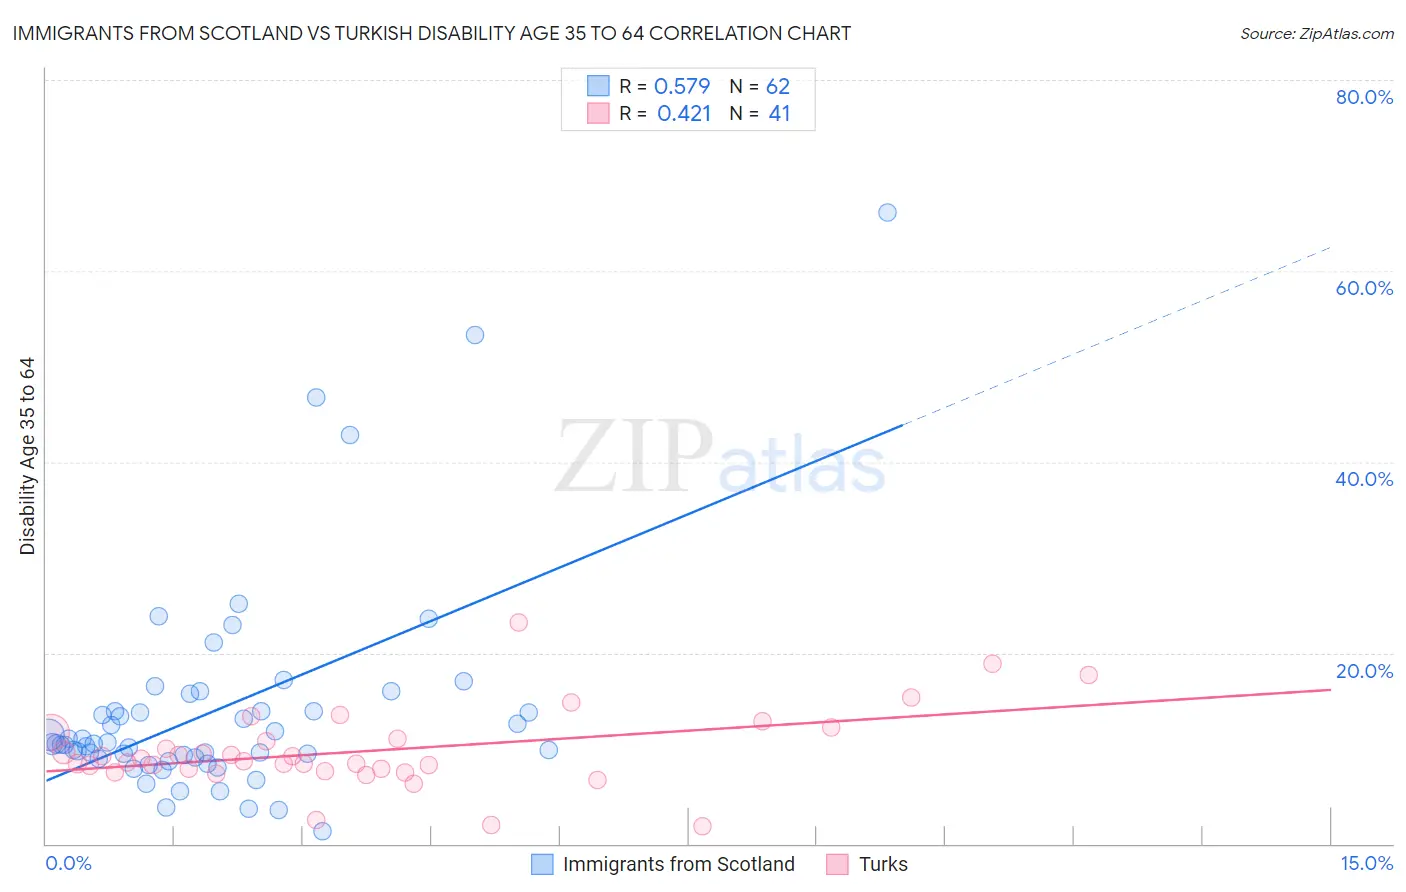
Immigrants from Scotland vs Turkish Disability Age 35 to 64 Correlation Chart
The statistical analysis conducted on geographies consisting of 196,374,606 people shows a substantial positive correlation between the proportion of Immigrants from Scotland and percentage of population with a disability between the ages 34 and 64 in the United States with a correlation coefficient (R) of 0.579 and weighted average of 10.7%. Similarly, the statistical analysis conducted on geographies consisting of 271,671,610 people shows a moderate positive correlation between the proportion of Turks and percentage of population with a disability between the ages 34 and 64 in the United States with a correlation coefficient (R) of 0.421 and weighted average of 9.7%, a difference of 11.3%.
Disability Age 35 to 64 Correlation Summary
| Measurement | Immigrants from Scotland | Turkish |
| Minimum | 1.3% | 1.9% |
| Maximum | 66.1% | 23.1% |
| Range | 64.9% | 21.2% |
| Mean | 14.1% | 9.7% |
| Median | 10.5% | 8.7% |
| Interquartile 25% (IQ1) | 9.1% | 7.7% |
| Interquartile 75% (IQ3) | 13.9% | 11.3% |
| Interquartile Range (IQR) | 4.9% | 3.6% |
| Standard Deviation (Sample) | 11.4% | 4.1% |
| Standard Deviation (Population) | 11.3% | 4.1% |
Similar Demographics by Disability Age 35 to 64
Demographics Similar to Immigrants from Scotland by Disability Age 35 to 64
In terms of disability age 35 to 64, the demographic groups most similar to Immigrants from Scotland are Costa Rican (10.7%, a difference of 0.050%), Immigrants from Southern Europe (10.7%, a difference of 0.060%), Immigrants from Costa Rica (10.7%, a difference of 0.12%), Australian (10.8%, a difference of 0.13%), and Immigrants from Saudi Arabia (10.8%, a difference of 0.17%).
| Demographics | Rating | Rank | Disability Age 35 to 64 |
| Immigrants | Immigrants | 92.5 /100 | #133 | Exceptional 10.7% |
| Immigrants | Ecuador | 92.5 /100 | #134 | Exceptional 10.7% |
| Greeks | 92.3 /100 | #135 | Exceptional 10.7% |
| Salvadorans | 91.9 /100 | #136 | Exceptional 10.7% |
| Immigrants | Costa Rica | 91.7 /100 | #137 | Exceptional 10.7% |
| Immigrants | Southern Europe | 91.5 /100 | #138 | Exceptional 10.7% |
| Costa Ricans | 91.4 /100 | #139 | Exceptional 10.7% |
| Immigrants | Scotland | 91.3 /100 | #140 | Exceptional 10.7% |
| Australians | 90.7 /100 | #141 | Exceptional 10.8% |
| Immigrants | Saudi Arabia | 90.6 /100 | #142 | Exceptional 10.8% |
| Sierra Leoneans | 89.7 /100 | #143 | Excellent 10.8% |
| Lithuanians | 88.7 /100 | #144 | Excellent 10.8% |
| Immigrants | Bangladesh | 85.6 /100 | #145 | Excellent 10.9% |
| South American Indians | 83.5 /100 | #146 | Excellent 10.9% |
| Immigrants | Eritrea | 83.4 /100 | #147 | Excellent 10.9% |
Demographics Similar to Turks by Disability Age 35 to 64
In terms of disability age 35 to 64, the demographic groups most similar to Turks are Immigrants from Indonesia (9.7%, a difference of 0.070%), Immigrants from Australia (9.7%, a difference of 0.15%), Bulgarian (9.7%, a difference of 0.25%), Immigrants from Cuba (9.7%, a difference of 0.28%), and Immigrants from Turkey (9.7%, a difference of 0.36%).
| Demographics | Rating | Rank | Disability Age 35 to 64 |
| Venezuelans | 100.0 /100 | #25 | Exceptional 9.4% |
| Immigrants | Sri Lanka | 100.0 /100 | #26 | Exceptional 9.5% |
| Immigrants | Asia | 100.0 /100 | #27 | Exceptional 9.5% |
| Immigrants | Pakistan | 100.0 /100 | #28 | Exceptional 9.5% |
| Immigrants | Ireland | 100.0 /100 | #29 | Exceptional 9.5% |
| Immigrants | Japan | 100.0 /100 | #30 | Exceptional 9.5% |
| Immigrants | Lithuania | 99.9 /100 | #31 | Exceptional 9.6% |
| Turks | 99.9 /100 | #32 | Exceptional 9.7% |
| Immigrants | Indonesia | 99.9 /100 | #33 | Exceptional 9.7% |
| Immigrants | Australia | 99.9 /100 | #34 | Exceptional 9.7% |
| Bulgarians | 99.9 /100 | #35 | Exceptional 9.7% |
| Immigrants | Cuba | 99.9 /100 | #36 | Exceptional 9.7% |
| Immigrants | Turkey | 99.9 /100 | #37 | Exceptional 9.7% |
| Egyptians | 99.9 /100 | #38 | Exceptional 9.7% |
| Immigrants | Belarus | 99.9 /100 | #39 | Exceptional 9.7% |