Native/Alaskan vs Jamaican 2 or more Vehicles in Household
COMPARE
Native/Alaskan
Jamaican
2 or more Vehicles in Household
2 or more Vehicles in Household Comparison
Natives/Alaskans
Jamaicans
57.0%
2 OR MORE VEHICLES IN HOUSEHOLD
95.0/ 100
METRIC RATING
119th/ 347
METRIC RANK
45.8%
2 OR MORE VEHICLES IN HOUSEHOLD
0.0/ 100
METRIC RATING
319th/ 347
METRIC RANK
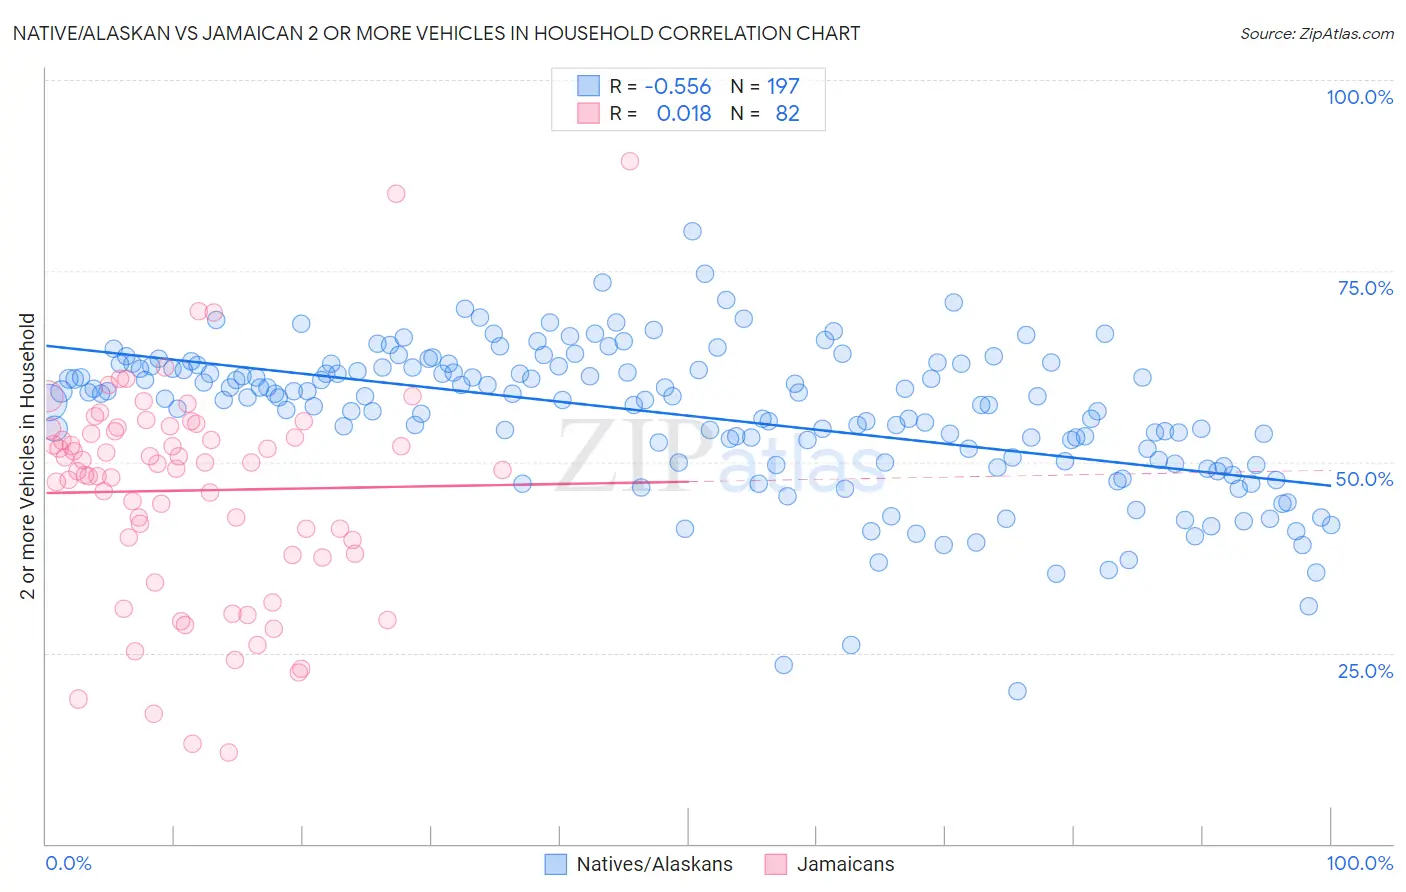
Native/Alaskan vs Jamaican 2 or more Vehicles in Household Correlation Chart
The statistical analysis conducted on geographies consisting of 512,668,217 people shows a substantial negative correlation between the proportion of Natives/Alaskans and percentage of households with 2 or more vehicles available in the United States with a correlation coefficient (R) of -0.556 and weighted average of 57.0%. Similarly, the statistical analysis conducted on geographies consisting of 367,700,586 people shows no correlation between the proportion of Jamaicans and percentage of households with 2 or more vehicles available in the United States with a correlation coefficient (R) of 0.018 and weighted average of 45.8%, a difference of 24.5%.
2 or more Vehicles in Household Correlation Summary
| Measurement | Native/Alaskan | Jamaican |
| Minimum | 20.0% | 12.0% |
| Maximum | 80.2% | 89.3% |
| Range | 60.2% | 77.3% |
| Mean | 56.1% | 46.3% |
| Median | 58.5% | 49.4% |
| Interquartile 25% (IQ1) | 50.1% | 38.0% |
| Interquartile 75% (IQ3) | 62.5% | 54.3% |
| Interquartile Range (IQR) | 12.4% | 16.3% |
| Standard Deviation (Sample) | 9.6% | 14.2% |
| Standard Deviation (Population) | 9.6% | 14.1% |
Similar Demographics by 2 or more Vehicles in Household
Demographics Similar to Natives/Alaskans by 2 or more Vehicles in Household
In terms of 2 or more vehicles in household, the demographic groups most similar to Natives/Alaskans are Asian (57.0%, a difference of 0.030%), Costa Rican (56.9%, a difference of 0.050%), Iraqi (57.1%, a difference of 0.19%), Sioux (56.8%, a difference of 0.21%), and Immigrants from Jordan (57.2%, a difference of 0.38%).
| Demographics | Rating | Rank | 2 or more Vehicles in Household |
| Pueblo | 98.0 /100 | #112 | Exceptional 57.5% |
| Zimbabweans | 96.9 /100 | #113 | Exceptional 57.2% |
| Immigrants | Lebanon | 96.8 /100 | #114 | Exceptional 57.2% |
| Chippewa | 96.6 /100 | #115 | Exceptional 57.2% |
| Immigrants | Jordan | 96.6 /100 | #116 | Exceptional 57.2% |
| Iraqis | 95.8 /100 | #117 | Exceptional 57.1% |
| Asians | 95.1 /100 | #118 | Exceptional 57.0% |
| Natives/Alaskans | 95.0 /100 | #119 | Exceptional 57.0% |
| Costa Ricans | 94.7 /100 | #120 | Exceptional 56.9% |
| Sioux | 93.8 /100 | #121 | Exceptional 56.8% |
| Immigrants | South Africa | 92.5 /100 | #122 | Exceptional 56.7% |
| Australians | 91.8 /100 | #123 | Exceptional 56.7% |
| New Zealanders | 91.8 /100 | #124 | Exceptional 56.7% |
| Tsimshian | 91.6 /100 | #125 | Exceptional 56.7% |
| Estonians | 90.9 /100 | #126 | Exceptional 56.6% |
Demographics Similar to Jamaicans by 2 or more Vehicles in Household
In terms of 2 or more vehicles in household, the demographic groups most similar to Jamaicans are Soviet Union (45.7%, a difference of 0.060%), Immigrants from Albania (46.0%, a difference of 0.52%), Immigrants from Haiti (46.5%, a difference of 1.7%), Cape Verdean (46.8%, a difference of 2.2%), and Puerto Rican (47.1%, a difference of 2.9%).
| Demographics | Rating | Rank | 2 or more Vehicles in Household |
| Haitians | 0.0 /100 | #312 | Tragic 47.6% |
| U.S. Virgin Islanders | 0.0 /100 | #313 | Tragic 47.5% |
| Immigrants | Ghana | 0.0 /100 | #314 | Tragic 47.4% |
| Puerto Ricans | 0.0 /100 | #315 | Tragic 47.1% |
| Cape Verdeans | 0.0 /100 | #316 | Tragic 46.8% |
| Immigrants | Haiti | 0.0 /100 | #317 | Tragic 46.5% |
| Immigrants | Albania | 0.0 /100 | #318 | Tragic 46.0% |
| Jamaicans | 0.0 /100 | #319 | Tragic 45.8% |
| Soviet Union | 0.0 /100 | #320 | Tragic 45.7% |
| Immigrants | Jamaica | 0.0 /100 | #321 | Tragic 44.5% |
| Senegalese | 0.0 /100 | #322 | Tragic 44.2% |
| Immigrants | Caribbean | 0.0 /100 | #323 | Tragic 44.2% |
| Immigrants | Cabo Verde | 0.0 /100 | #324 | Tragic 43.3% |
| Immigrants | West Indies | 0.0 /100 | #325 | Tragic 43.1% |
| Immigrants | Senegal | 0.0 /100 | #326 | Tragic 43.0% |