Celtic vs Jamaican Disability Age Over 75
COMPARE
Celtic
Jamaican
Disability Age Over 75
Disability Age Over 75 Comparison
Celtics
Jamaicans
47.2%
DISABILITY AGE OVER 75
58.7/ 100
METRIC RATING
169th/ 347
METRIC RANK
47.7%
DISABILITY AGE OVER 75
19.0/ 100
METRIC RATING
206th/ 347
METRIC RANK
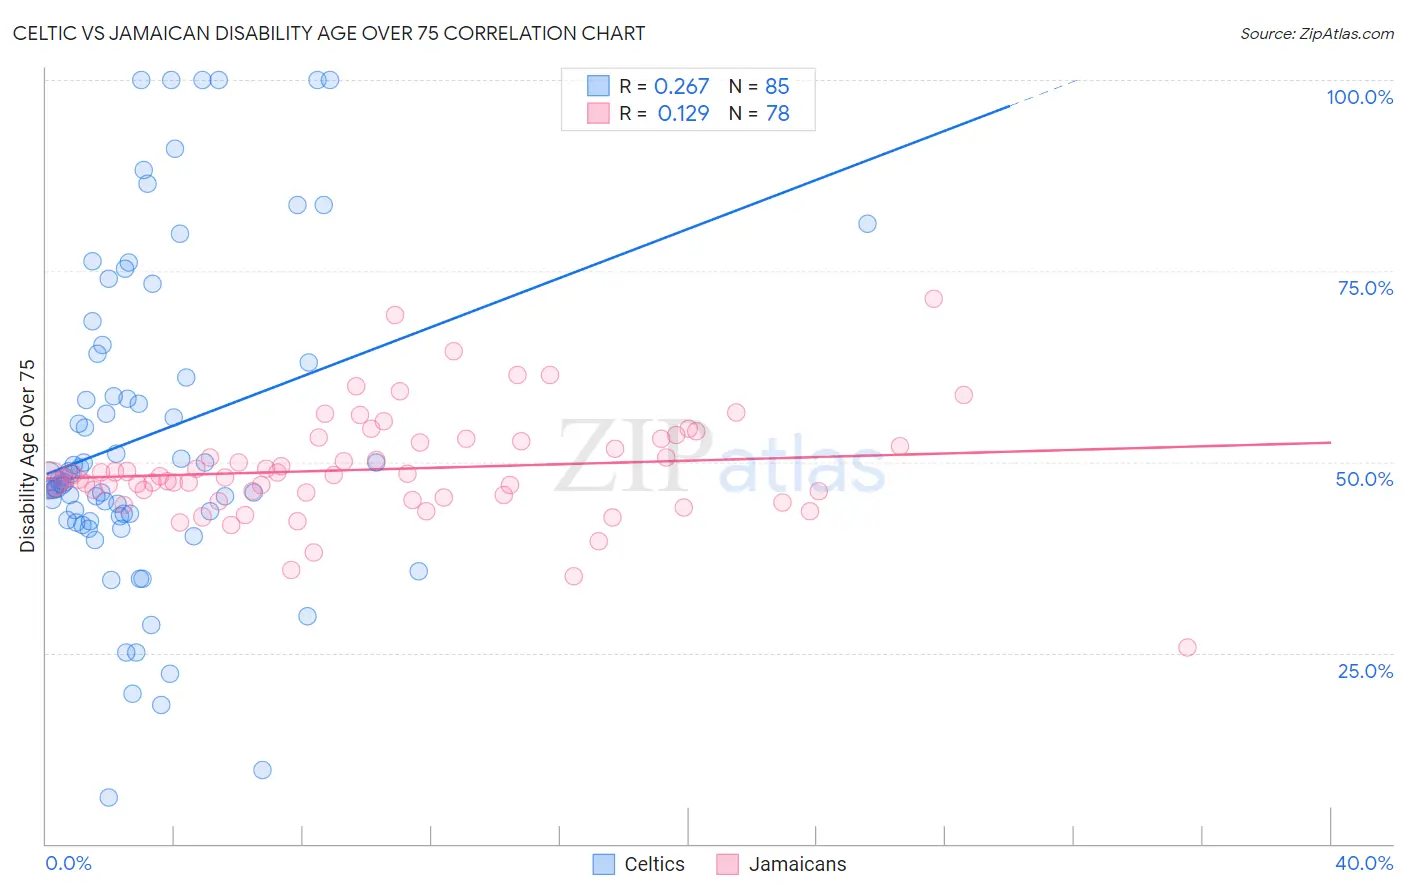
Celtic vs Jamaican Disability Age Over 75 Correlation Chart
The statistical analysis conducted on geographies consisting of 168,767,238 people shows a weak positive correlation between the proportion of Celtics and percentage of population with a disability over the age of 75 in the United States with a correlation coefficient (R) of 0.267 and weighted average of 47.2%. Similarly, the statistical analysis conducted on geographies consisting of 366,963,614 people shows a poor positive correlation between the proportion of Jamaicans and percentage of population with a disability over the age of 75 in the United States with a correlation coefficient (R) of 0.129 and weighted average of 47.7%, a difference of 1.0%.
Disability Age Over 75 Correlation Summary
| Measurement | Celtic | Jamaican |
| Minimum | 6.0% | 25.7% |
| Maximum | 100.0% | 71.4% |
| Range | 94.0% | 45.7% |
| Mean | 53.5% | 49.0% |
| Median | 47.6% | 48.1% |
| Interquartile 25% (IQ1) | 42.6% | 45.7% |
| Interquartile 75% (IQ3) | 63.6% | 52.8% |
| Interquartile Range (IQR) | 21.0% | 7.1% |
| Standard Deviation (Sample) | 21.1% | 7.0% |
| Standard Deviation (Population) | 21.0% | 7.0% |
Similar Demographics by Disability Age Over 75
Demographics Similar to Celtics by Disability Age Over 75
In terms of disability age over 75, the demographic groups most similar to Celtics are Kenyan (47.2%, a difference of 0.0%), German Russian (47.3%, a difference of 0.060%), Moroccan (47.2%, a difference of 0.10%), Immigrants from Africa (47.3%, a difference of 0.12%), and Immigrants from Sierra Leone (47.2%, a difference of 0.13%).
| Demographics | Rating | Rank | Disability Age Over 75 |
| Pennsylvania Germans | 66.0 /100 | #162 | Good 47.2% |
| Immigrants | Eastern Africa | 65.5 /100 | #163 | Good 47.2% |
| French | 64.6 /100 | #164 | Good 47.2% |
| Immigrants | Zimbabwe | 64.4 /100 | #165 | Good 47.2% |
| Immigrants | Sierra Leone | 64.4 /100 | #166 | Good 47.2% |
| Moroccans | 62.9 /100 | #167 | Good 47.2% |
| Kenyans | 58.8 /100 | #168 | Average 47.2% |
| Celtics | 58.7 /100 | #169 | Average 47.2% |
| German Russians | 56.2 /100 | #170 | Average 47.3% |
| Immigrants | Africa | 53.6 /100 | #171 | Average 47.3% |
| Scotch-Irish | 52.5 /100 | #172 | Average 47.3% |
| Alsatians | 51.9 /100 | #173 | Average 47.3% |
| Whites/Caucasians | 50.0 /100 | #174 | Average 47.3% |
| Immigrants | Haiti | 49.7 /100 | #175 | Average 47.3% |
| Ecuadorians | 46.7 /100 | #176 | Average 47.4% |
Demographics Similar to Jamaicans by Disability Age Over 75
In terms of disability age over 75, the demographic groups most similar to Jamaicans are Immigrants from Ghana (47.7%, a difference of 0.0%), Nigerian (47.7%, a difference of 0.010%), Trinidadian and Tobagonian (47.7%, a difference of 0.040%), Immigrants from Cuba (47.7%, a difference of 0.060%), and Immigrants from Bahamas (47.7%, a difference of 0.060%).
| Demographics | Rating | Rank | Disability Age Over 75 |
| Immigrants | Eritrea | 22.4 /100 | #199 | Fair 47.7% |
| Immigrants | Somalia | 21.4 /100 | #200 | Fair 47.7% |
| Immigrants | Cuba | 20.9 /100 | #201 | Fair 47.7% |
| Immigrants | Bahamas | 20.7 /100 | #202 | Fair 47.7% |
| Trinidadians and Tobagonians | 20.0 /100 | #203 | Fair 47.7% |
| Nigerians | 19.2 /100 | #204 | Poor 47.7% |
| Immigrants | Ghana | 19.1 /100 | #205 | Poor 47.7% |
| Jamaicans | 19.0 /100 | #206 | Poor 47.7% |
| Immigrants | Syria | 17.4 /100 | #207 | Poor 47.8% |
| Immigrants | Senegal | 16.9 /100 | #208 | Poor 47.8% |
| Immigrants | Indonesia | 14.2 /100 | #209 | Poor 47.8% |
| Vietnamese | 11.9 /100 | #210 | Poor 47.9% |
| Panamanians | 11.8 /100 | #211 | Poor 47.9% |
| Immigrants | Burma/Myanmar | 11.7 /100 | #212 | Poor 47.9% |
| Laotians | 11.5 /100 | #213 | Poor 47.9% |