Native/Alaskan vs Bulgarian Family Households with Children
COMPARE
Native/Alaskan
Bulgarian
Family Households with Children
Family Households with Children Comparison
Natives/Alaskans
Bulgarians
28.4%
FAMILY HOUSEHOLDS WITH CHILDREN
99.8/ 100
METRIC RATING
80th/ 347
METRIC RANK
27.0%
FAMILY HOUSEHOLDS WITH CHILDREN
5.8/ 100
METRIC RATING
230th/ 347
METRIC RANK
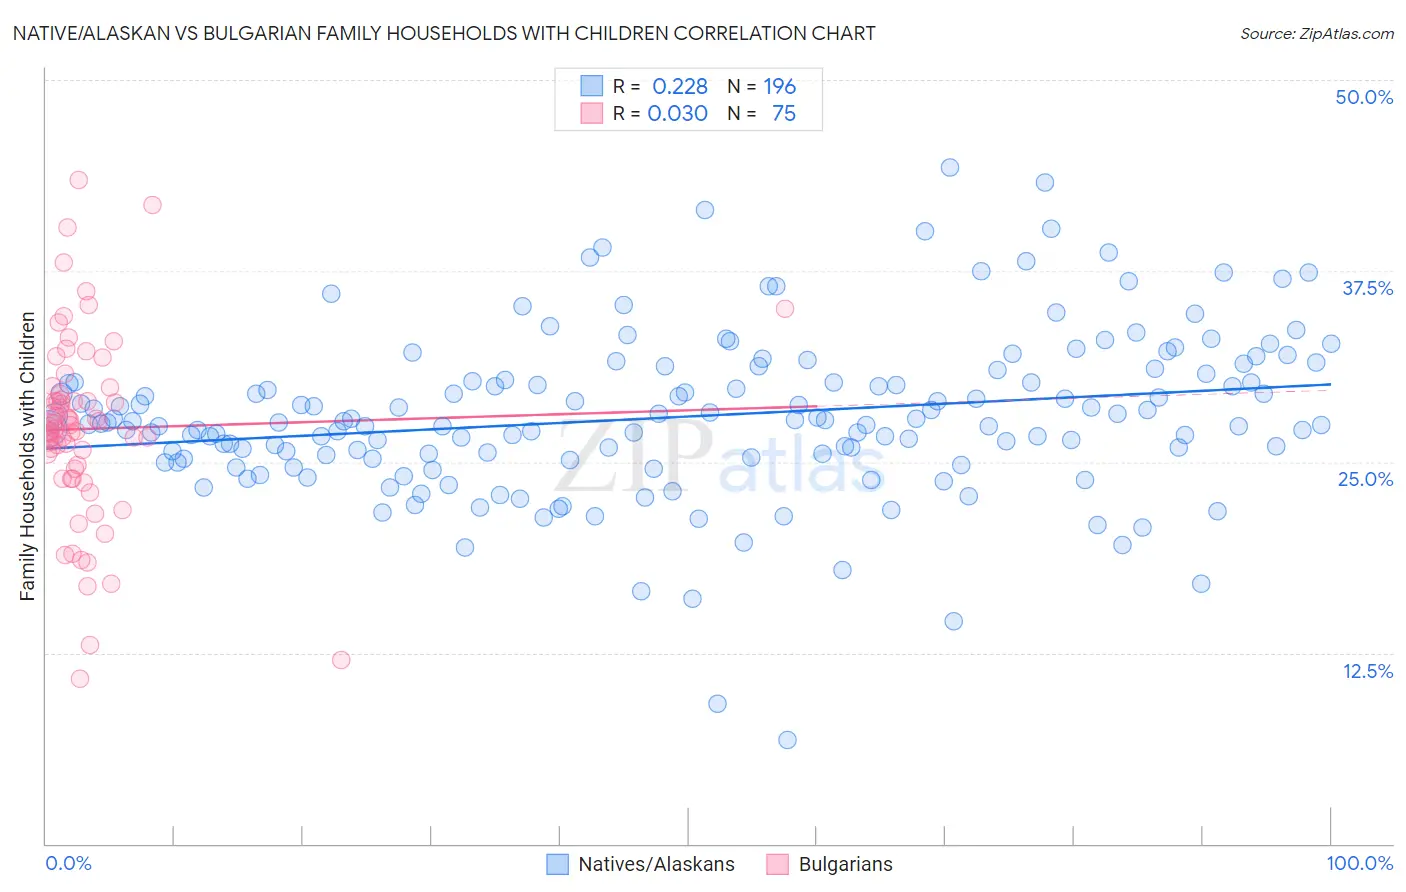
Native/Alaskan vs Bulgarian Family Households with Children Correlation Chart
The statistical analysis conducted on geographies consisting of 512,450,459 people shows a weak positive correlation between the proportion of Natives/Alaskans and percentage of family households with children in the United States with a correlation coefficient (R) of 0.228 and weighted average of 28.4%. Similarly, the statistical analysis conducted on geographies consisting of 205,477,079 people shows no correlation between the proportion of Bulgarians and percentage of family households with children in the United States with a correlation coefficient (R) of 0.030 and weighted average of 27.0%, a difference of 5.1%.
Family Households with Children Correlation Summary
| Measurement | Native/Alaskan | Bulgarian |
| Minimum | 6.8% | 10.8% |
| Maximum | 44.2% | 43.4% |
| Range | 37.4% | 32.7% |
| Mean | 28.0% | 27.2% |
| Median | 27.6% | 27.3% |
| Interquartile 25% (IQ1) | 25.2% | 24.6% |
| Interquartile 75% (IQ3) | 30.3% | 29.5% |
| Interquartile Range (IQR) | 5.1% | 4.9% |
| Standard Deviation (Sample) | 5.4% | 6.1% |
| Standard Deviation (Population) | 5.4% | 6.0% |
Similar Demographics by Family Households with Children
Demographics Similar to Natives/Alaskans by Family Households with Children
In terms of family households with children, the demographic groups most similar to Natives/Alaskans are Immigrants from Iraq (28.4%, a difference of 0.010%), South American (28.4%, a difference of 0.020%), Immigrants from Nepal (28.4%, a difference of 0.040%), Kenyan (28.4%, a difference of 0.070%), and Nigerian (28.4%, a difference of 0.080%).
| Demographics | Rating | Rank | Family Households with Children |
| Iraqis | 99.9 /100 | #73 | Exceptional 28.5% |
| Laotians | 99.9 /100 | #74 | Exceptional 28.5% |
| Immigrants | Jordan | 99.9 /100 | #75 | Exceptional 28.4% |
| Immigrants | Sri Lanka | 99.9 /100 | #76 | Exceptional 28.4% |
| Nigerians | 99.8 /100 | #77 | Exceptional 28.4% |
| Immigrants | Nepal | 99.8 /100 | #78 | Exceptional 28.4% |
| Immigrants | Iraq | 99.8 /100 | #79 | Exceptional 28.4% |
| Natives/Alaskans | 99.8 /100 | #80 | Exceptional 28.4% |
| South Americans | 99.8 /100 | #81 | Exceptional 28.4% |
| Kenyans | 99.8 /100 | #82 | Exceptional 28.4% |
| Nicaraguans | 99.8 /100 | #83 | Exceptional 28.4% |
| Costa Ricans | 99.8 /100 | #84 | Exceptional 28.4% |
| Immigrants | Syria | 99.8 /100 | #85 | Exceptional 28.4% |
| Immigrants | Western Africa | 99.6 /100 | #86 | Exceptional 28.3% |
| Colombians | 99.6 /100 | #87 | Exceptional 28.3% |
Demographics Similar to Bulgarians by Family Households with Children
In terms of family households with children, the demographic groups most similar to Bulgarians are Luxembourger (27.0%, a difference of 0.030%), Immigrants from Caribbean (27.0%, a difference of 0.050%), Yugoslavian (27.0%, a difference of 0.070%), Czechoslovakian (27.0%, a difference of 0.080%), and Tsimshian (27.0%, a difference of 0.080%).
| Demographics | Rating | Rank | Family Households with Children |
| Pima | 9.2 /100 | #223 | Tragic 27.1% |
| Germans | 8.7 /100 | #224 | Tragic 27.1% |
| Canadians | 7.5 /100 | #225 | Tragic 27.1% |
| Czechoslovakians | 6.6 /100 | #226 | Tragic 27.0% |
| Tsimshian | 6.6 /100 | #227 | Tragic 27.0% |
| Scottish | 6.5 /100 | #228 | Tragic 27.0% |
| Immigrants | Caribbean | 6.3 /100 | #229 | Tragic 27.0% |
| Bulgarians | 5.8 /100 | #230 | Tragic 27.0% |
| Luxembourgers | 5.5 /100 | #231 | Tragic 27.0% |
| Yugoslavians | 5.1 /100 | #232 | Tragic 27.0% |
| Immigrants | Italy | 5.0 /100 | #233 | Tragic 27.0% |
| Immigrants | Germany | 4.4 /100 | #234 | Tragic 27.0% |
| Immigrants | Morocco | 4.2 /100 | #235 | Tragic 27.0% |
| Cape Verdeans | 3.6 /100 | #236 | Tragic 26.9% |
| Immigrants | Netherlands | 3.5 /100 | #237 | Tragic 26.9% |