Native/Alaskan vs British Disability Age 65 to 74
COMPARE
Native/Alaskan
British
Disability Age 65 to 74
Disability Age 65 to 74 Comparison
Natives/Alaskans
British
30.4%
DISABILITY AGE 65 TO 74
0.0/ 100
METRIC RATING
332nd/ 347
METRIC RANK
23.0%
DISABILITY AGE 65 TO 74
73.9/ 100
METRIC RATING
155th/ 347
METRIC RANK
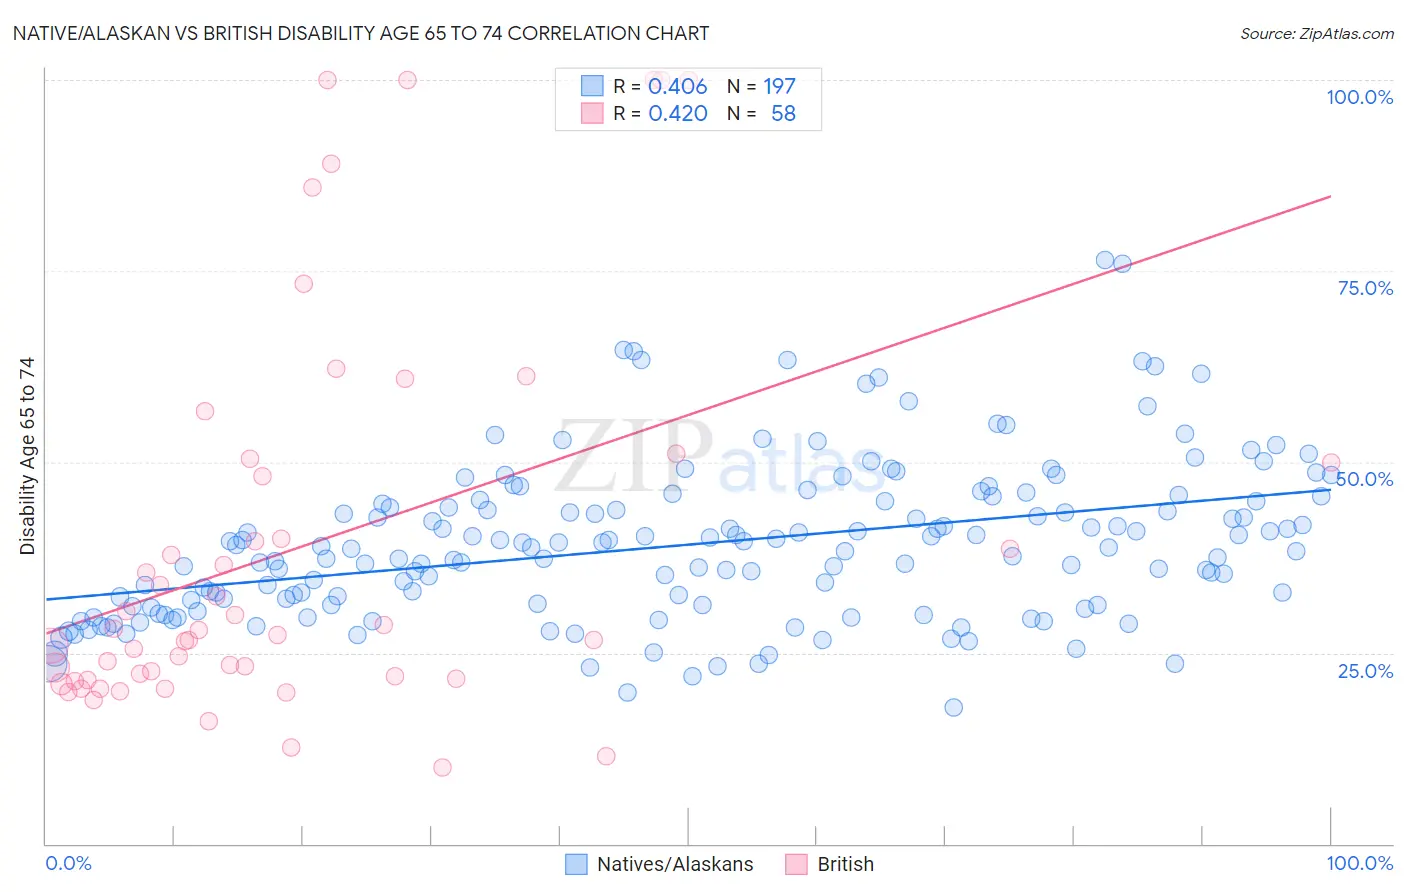
Native/Alaskan vs British Disability Age 65 to 74 Correlation Chart
The statistical analysis conducted on geographies consisting of 511,555,776 people shows a moderate positive correlation between the proportion of Natives/Alaskans and percentage of population with a disability between the ages 65 and 75 in the United States with a correlation coefficient (R) of 0.406 and weighted average of 30.4%. Similarly, the statistical analysis conducted on geographies consisting of 529,866,970 people shows a moderate positive correlation between the proportion of British and percentage of population with a disability between the ages 65 and 75 in the United States with a correlation coefficient (R) of 0.420 and weighted average of 23.0%, a difference of 32.2%.
Disability Age 65 to 74 Correlation Summary
| Measurement | Native/Alaskan | British |
| Minimum | 17.9% | 10.0% |
| Maximum | 76.4% | 100.0% |
| Range | 58.5% | 90.0% |
| Mean | 39.2% | 38.7% |
| Median | 38.6% | 27.6% |
| Interquartile 25% (IQ1) | 31.2% | 21.6% |
| Interquartile 75% (IQ3) | 44.7% | 50.0% |
| Interquartile Range (IQR) | 13.4% | 28.4% |
| Standard Deviation (Sample) | 10.3% | 25.5% |
| Standard Deviation (Population) | 10.3% | 25.2% |
Similar Demographics by Disability Age 65 to 74
Demographics Similar to Natives/Alaskans by Disability Age 65 to 74
In terms of disability age 65 to 74, the demographic groups most similar to Natives/Alaskans are Colville (30.5%, a difference of 0.52%), Chickasaw (30.2%, a difference of 0.62%), Creek (30.2%, a difference of 0.63%), Choctaw (30.2%, a difference of 0.66%), and Alaska Native (30.6%, a difference of 0.77%).
| Demographics | Rating | Rank | Disability Age 65 to 74 |
| Dutch West Indians | 0.0 /100 | #325 | Tragic 29.6% |
| Yakama | 0.0 /100 | #326 | Tragic 29.6% |
| Apache | 0.0 /100 | #327 | Tragic 29.7% |
| Hopi | 0.0 /100 | #328 | Tragic 30.0% |
| Choctaw | 0.0 /100 | #329 | Tragic 30.2% |
| Creek | 0.0 /100 | #330 | Tragic 30.2% |
| Chickasaw | 0.0 /100 | #331 | Tragic 30.2% |
| Natives/Alaskans | 0.0 /100 | #332 | Tragic 30.4% |
| Colville | 0.0 /100 | #333 | Tragic 30.5% |
| Alaska Natives | 0.0 /100 | #334 | Tragic 30.6% |
| Cheyenne | 0.0 /100 | #335 | Tragic 31.1% |
| Yuman | 0.0 /100 | #336 | Tragic 31.5% |
| Houma | 0.0 /100 | #337 | Tragic 32.3% |
| Alaskan Athabascans | 0.0 /100 | #338 | Tragic 32.4% |
| Kiowa | 0.0 /100 | #339 | Tragic 32.6% |
Demographics Similar to British by Disability Age 65 to 74
In terms of disability age 65 to 74, the demographic groups most similar to British are Sri Lankan (23.0%, a difference of 0.010%), Immigrants from Western Asia (23.0%, a difference of 0.010%), Slavic (23.0%, a difference of 0.10%), Czechoslovakian (23.0%, a difference of 0.11%), and Finnish (22.9%, a difference of 0.21%).
| Demographics | Rating | Rank | Disability Age 65 to 74 |
| New Zealanders | 79.9 /100 | #148 | Good 22.9% |
| Swiss | 79.7 /100 | #149 | Good 22.9% |
| Canadians | 77.7 /100 | #150 | Good 22.9% |
| Immigrants | Morocco | 77.6 /100 | #151 | Good 22.9% |
| Finns | 76.5 /100 | #152 | Good 22.9% |
| Slavs | 75.2 /100 | #153 | Good 23.0% |
| Sri Lankans | 74.0 /100 | #154 | Good 23.0% |
| British | 73.9 /100 | #155 | Good 23.0% |
| Immigrants | Western Asia | 73.8 /100 | #156 | Good 23.0% |
| Czechoslovakians | 72.4 /100 | #157 | Good 23.0% |
| Immigrants | Vietnam | 69.1 /100 | #158 | Good 23.1% |
| South American Indians | 65.5 /100 | #159 | Good 23.1% |
| Koreans | 64.2 /100 | #160 | Good 23.1% |
| Immigrants | Cameroon | 63.8 /100 | #161 | Good 23.1% |
| Europeans | 61.2 /100 | #162 | Good 23.2% |