Native/Alaskan vs Croatian Disability Age 65 to 74
COMPARE
Native/Alaskan
Croatian
Disability Age 65 to 74
Disability Age 65 to 74 Comparison
Natives/Alaskans
Croatians
30.4%
DISABILITY AGE 65 TO 74
0.0/ 100
METRIC RATING
332nd/ 347
METRIC RANK
21.8%
DISABILITY AGE 65 TO 74
98.9/ 100
METRIC RATING
81st/ 347
METRIC RANK
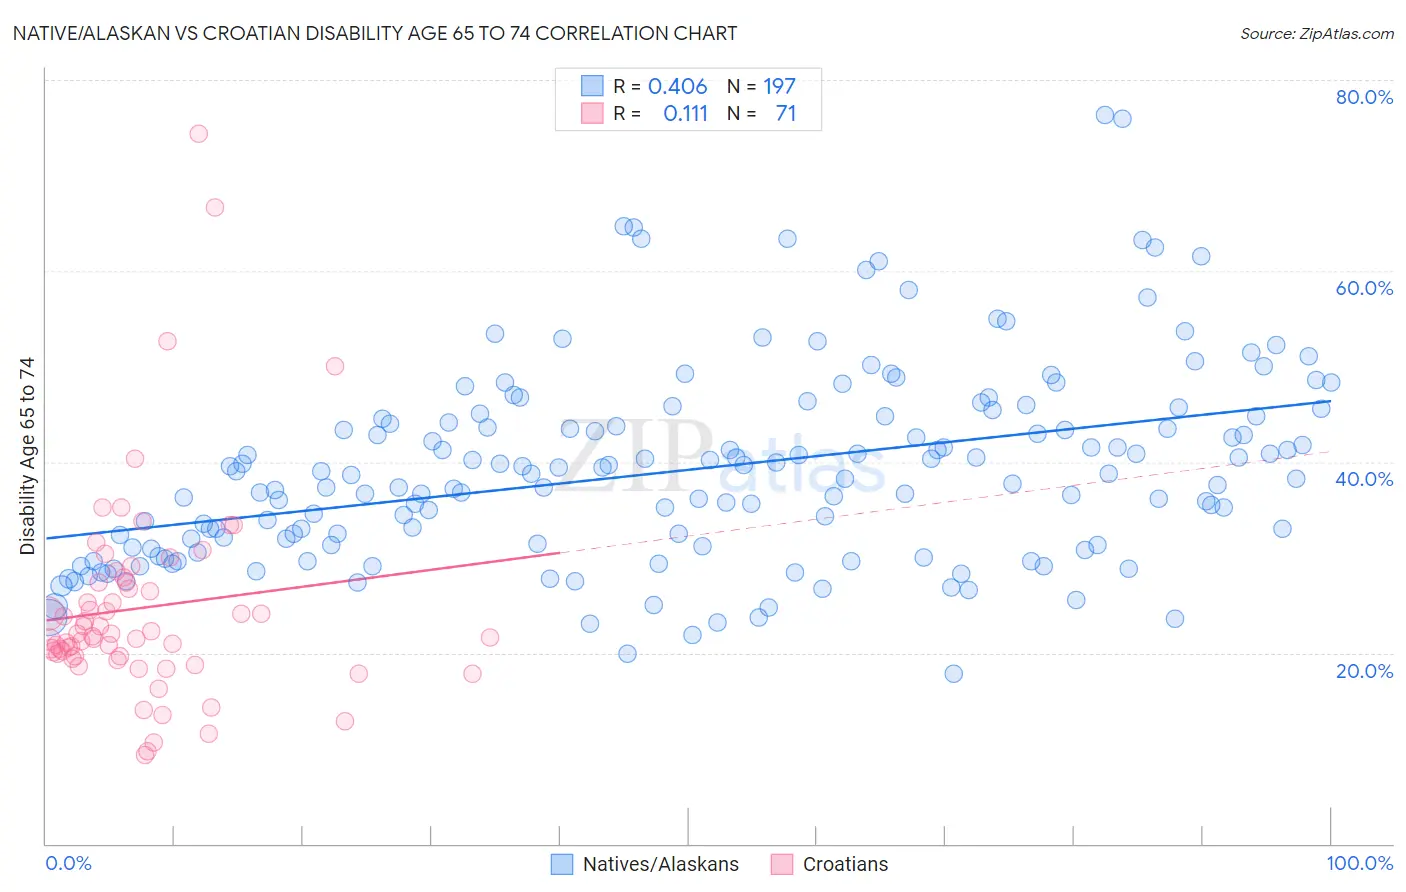
Native/Alaskan vs Croatian Disability Age 65 to 74 Correlation Chart
The statistical analysis conducted on geographies consisting of 511,555,776 people shows a moderate positive correlation between the proportion of Natives/Alaskans and percentage of population with a disability between the ages 65 and 75 in the United States with a correlation coefficient (R) of 0.406 and weighted average of 30.4%. Similarly, the statistical analysis conducted on geographies consisting of 375,202,419 people shows a poor positive correlation between the proportion of Croatians and percentage of population with a disability between the ages 65 and 75 in the United States with a correlation coefficient (R) of 0.111 and weighted average of 21.8%, a difference of 39.3%.
Disability Age 65 to 74 Correlation Summary
| Measurement | Native/Alaskan | Croatian |
| Minimum | 17.9% | 9.4% |
| Maximum | 76.4% | 74.4% |
| Range | 58.5% | 65.1% |
| Mean | 39.2% | 24.7% |
| Median | 38.6% | 21.8% |
| Interquartile 25% (IQ1) | 31.2% | 19.6% |
| Interquartile 75% (IQ3) | 44.7% | 27.4% |
| Interquartile Range (IQR) | 13.4% | 7.8% |
| Standard Deviation (Sample) | 10.3% | 11.1% |
| Standard Deviation (Population) | 10.3% | 11.0% |
Similar Demographics by Disability Age 65 to 74
Demographics Similar to Natives/Alaskans by Disability Age 65 to 74
In terms of disability age 65 to 74, the demographic groups most similar to Natives/Alaskans are Colville (30.5%, a difference of 0.52%), Chickasaw (30.2%, a difference of 0.62%), Creek (30.2%, a difference of 0.63%), Choctaw (30.2%, a difference of 0.66%), and Alaska Native (30.6%, a difference of 0.77%).
| Demographics | Rating | Rank | Disability Age 65 to 74 |
| Dutch West Indians | 0.0 /100 | #325 | Tragic 29.6% |
| Yakama | 0.0 /100 | #326 | Tragic 29.6% |
| Apache | 0.0 /100 | #327 | Tragic 29.7% |
| Hopi | 0.0 /100 | #328 | Tragic 30.0% |
| Choctaw | 0.0 /100 | #329 | Tragic 30.2% |
| Creek | 0.0 /100 | #330 | Tragic 30.2% |
| Chickasaw | 0.0 /100 | #331 | Tragic 30.2% |
| Natives/Alaskans | 0.0 /100 | #332 | Tragic 30.4% |
| Colville | 0.0 /100 | #333 | Tragic 30.5% |
| Alaska Natives | 0.0 /100 | #334 | Tragic 30.6% |
| Cheyenne | 0.0 /100 | #335 | Tragic 31.1% |
| Yuman | 0.0 /100 | #336 | Tragic 31.5% |
| Houma | 0.0 /100 | #337 | Tragic 32.3% |
| Alaskan Athabascans | 0.0 /100 | #338 | Tragic 32.4% |
| Kiowa | 0.0 /100 | #339 | Tragic 32.6% |
Demographics Similar to Croatians by Disability Age 65 to 74
In terms of disability age 65 to 74, the demographic groups most similar to Croatians are Immigrants from Norway (21.8%, a difference of 0.070%), Immigrants from Eastern Europe (21.8%, a difference of 0.080%), Venezuelan (21.8%, a difference of 0.080%), Immigrants from Poland (21.8%, a difference of 0.14%), and Greek (21.8%, a difference of 0.20%).
| Demographics | Rating | Rank | Disability Age 65 to 74 |
| Cambodians | 99.0 /100 | #74 | Exceptional 21.8% |
| Mongolians | 99.0 /100 | #75 | Exceptional 21.8% |
| Greeks | 99.0 /100 | #76 | Exceptional 21.8% |
| Immigrants | Poland | 99.0 /100 | #77 | Exceptional 21.8% |
| Immigrants | Eastern Europe | 99.0 /100 | #78 | Exceptional 21.8% |
| Venezuelans | 99.0 /100 | #79 | Exceptional 21.8% |
| Immigrants | Norway | 98.9 /100 | #80 | Exceptional 21.8% |
| Croatians | 98.9 /100 | #81 | Exceptional 21.8% |
| Immigrants | Indonesia | 98.7 /100 | #82 | Exceptional 21.9% |
| Immigrants | Brazil | 98.5 /100 | #83 | Exceptional 21.9% |
| Immigrants | Spain | 98.5 /100 | #84 | Exceptional 21.9% |
| Immigrants | Lebanon | 98.4 /100 | #85 | Exceptional 21.9% |
| South Africans | 98.4 /100 | #86 | Exceptional 21.9% |
| Australians | 98.0 /100 | #87 | Exceptional 22.0% |
| Immigrants | Netherlands | 97.9 /100 | #88 | Exceptional 22.0% |