Immigrants from Uruguay vs British Disability Age 65 to 74
COMPARE
Immigrants from Uruguay
British
Disability Age 65 to 74
Disability Age 65 to 74 Comparison
Immigrants from Uruguay
British
22.6%
DISABILITY AGE 65 TO 74
90.1/ 100
METRIC RATING
129th/ 347
METRIC RANK
23.0%
DISABILITY AGE 65 TO 74
73.9/ 100
METRIC RATING
155th/ 347
METRIC RANK
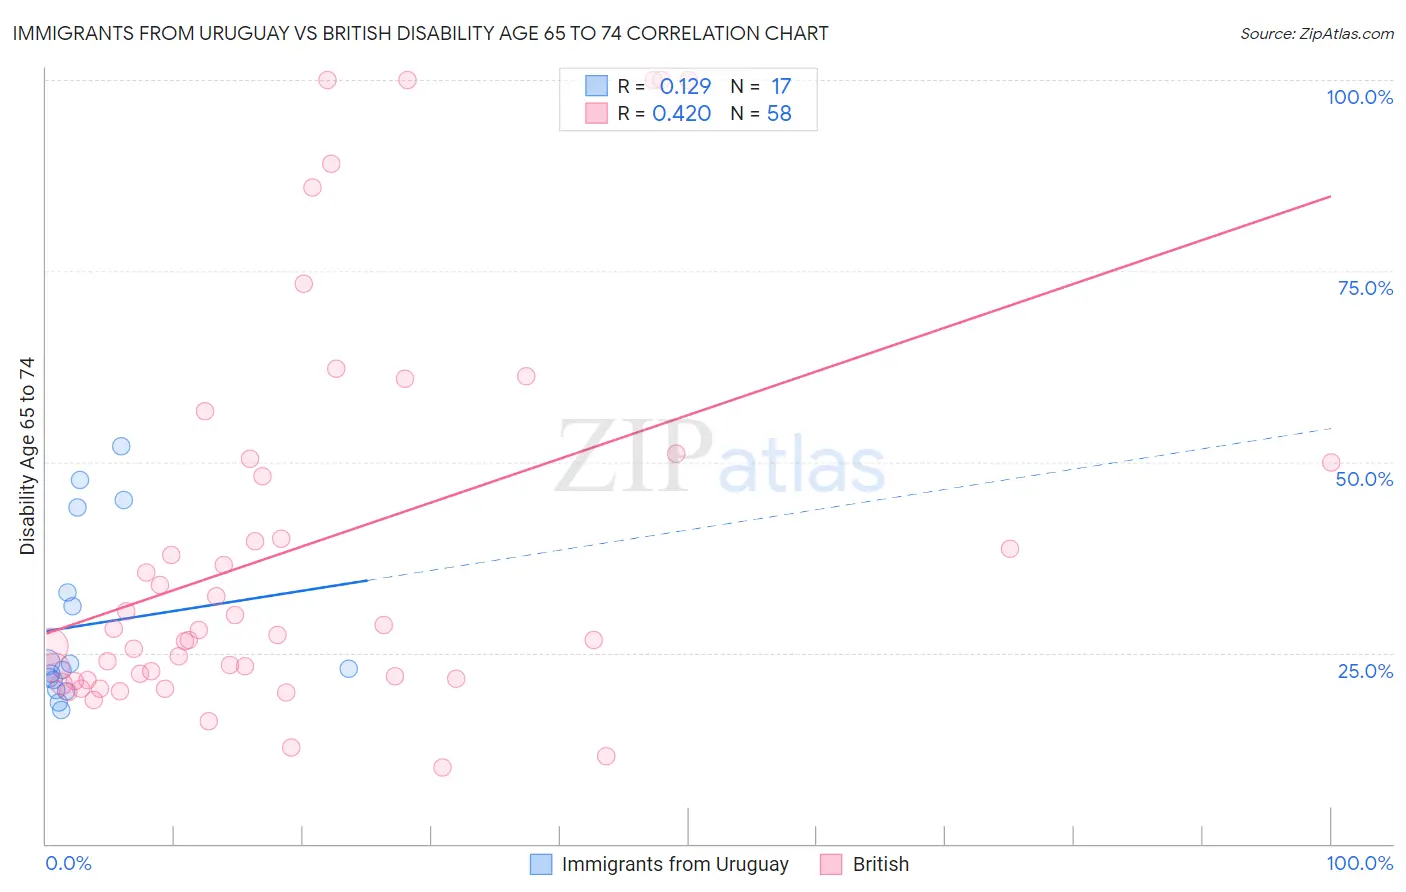
Immigrants from Uruguay vs British Disability Age 65 to 74 Correlation Chart
The statistical analysis conducted on geographies consisting of 133,228,680 people shows a poor positive correlation between the proportion of Immigrants from Uruguay and percentage of population with a disability between the ages 65 and 75 in the United States with a correlation coefficient (R) of 0.129 and weighted average of 22.6%. Similarly, the statistical analysis conducted on geographies consisting of 529,866,970 people shows a moderate positive correlation between the proportion of British and percentage of population with a disability between the ages 65 and 75 in the United States with a correlation coefficient (R) of 0.420 and weighted average of 23.0%, a difference of 1.8%.
Disability Age 65 to 74 Correlation Summary
| Measurement | Immigrants from Uruguay | British |
| Minimum | 17.5% | 10.0% |
| Maximum | 52.1% | 100.0% |
| Range | 34.6% | 90.0% |
| Mean | 28.7% | 38.7% |
| Median | 22.9% | 27.6% |
| Interquartile 25% (IQ1) | 20.8% | 21.6% |
| Interquartile 75% (IQ3) | 38.5% | 50.0% |
| Interquartile Range (IQR) | 17.7% | 28.4% |
| Standard Deviation (Sample) | 11.4% | 25.5% |
| Standard Deviation (Population) | 11.0% | 25.2% |
Similar Demographics by Disability Age 65 to 74
Demographics Similar to Immigrants from Uruguay by Disability Age 65 to 74
In terms of disability age 65 to 74, the demographic groups most similar to Immigrants from Uruguay are Immigrants from Albania (22.6%, a difference of 0.010%), Immigrants from Costa Rica (22.6%, a difference of 0.060%), Immigrants from Nepal (22.6%, a difference of 0.10%), Costa Rican (22.6%, a difference of 0.14%), and Northern European (22.6%, a difference of 0.18%).
| Demographics | Rating | Rank | Disability Age 65 to 74 |
| Immigrants | Jordan | 93.5 /100 | #122 | Exceptional 22.4% |
| Hungarians | 93.3 /100 | #123 | Exceptional 22.4% |
| Norwegians | 92.5 /100 | #124 | Exceptional 22.5% |
| Immigrants | Western Europe | 92.3 /100 | #125 | Exceptional 22.5% |
| Lebanese | 92.2 /100 | #126 | Exceptional 22.5% |
| Slovaks | 91.6 /100 | #127 | Exceptional 22.5% |
| Immigrants | Costa Rica | 90.4 /100 | #128 | Exceptional 22.6% |
| Immigrants | Uruguay | 90.1 /100 | #129 | Exceptional 22.6% |
| Immigrants | Albania | 90.0 /100 | #130 | Excellent 22.6% |
| Immigrants | Nepal | 89.4 /100 | #131 | Excellent 22.6% |
| Costa Ricans | 89.2 /100 | #132 | Excellent 22.6% |
| Northern Europeans | 88.9 /100 | #133 | Excellent 22.6% |
| Afghans | 88.6 /100 | #134 | Excellent 22.6% |
| Immigrants | Ukraine | 88.4 /100 | #135 | Excellent 22.6% |
| Ethiopians | 87.9 /100 | #136 | Excellent 22.7% |
Demographics Similar to British by Disability Age 65 to 74
In terms of disability age 65 to 74, the demographic groups most similar to British are Sri Lankan (23.0%, a difference of 0.010%), Immigrants from Western Asia (23.0%, a difference of 0.010%), Slavic (23.0%, a difference of 0.10%), Czechoslovakian (23.0%, a difference of 0.11%), and Finnish (22.9%, a difference of 0.21%).
| Demographics | Rating | Rank | Disability Age 65 to 74 |
| New Zealanders | 79.9 /100 | #148 | Good 22.9% |
| Swiss | 79.7 /100 | #149 | Good 22.9% |
| Canadians | 77.7 /100 | #150 | Good 22.9% |
| Immigrants | Morocco | 77.6 /100 | #151 | Good 22.9% |
| Finns | 76.5 /100 | #152 | Good 22.9% |
| Slavs | 75.2 /100 | #153 | Good 23.0% |
| Sri Lankans | 74.0 /100 | #154 | Good 23.0% |
| British | 73.9 /100 | #155 | Good 23.0% |
| Immigrants | Western Asia | 73.8 /100 | #156 | Good 23.0% |
| Czechoslovakians | 72.4 /100 | #157 | Good 23.0% |
| Immigrants | Vietnam | 69.1 /100 | #158 | Good 23.1% |
| South American Indians | 65.5 /100 | #159 | Good 23.1% |
| Koreans | 64.2 /100 | #160 | Good 23.1% |
| Immigrants | Cameroon | 63.8 /100 | #161 | Good 23.1% |
| Europeans | 61.2 /100 | #162 | Good 23.2% |