Moroccan vs British Disability Age 65 to 74
COMPARE
Moroccan
British
Disability Age 65 to 74
Disability Age 65 to 74 Comparison
Moroccans
British
23.3%
DISABILITY AGE 65 TO 74
54.2/ 100
METRIC RATING
170th/ 347
METRIC RANK
23.0%
DISABILITY AGE 65 TO 74
73.9/ 100
METRIC RATING
155th/ 347
METRIC RANK
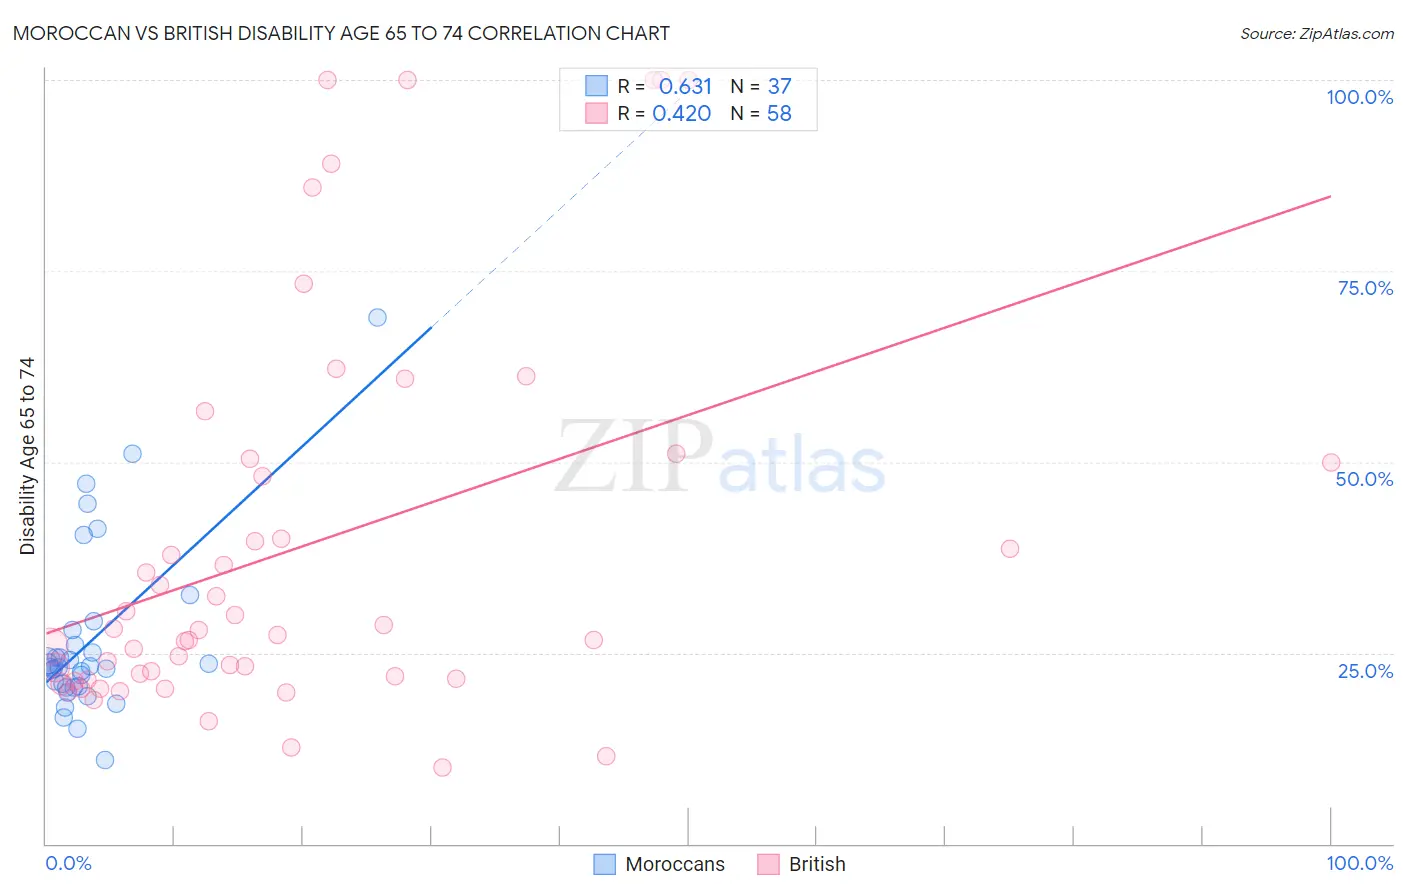
Moroccan vs British Disability Age 65 to 74 Correlation Chart
The statistical analysis conducted on geographies consisting of 201,651,001 people shows a significant positive correlation between the proportion of Moroccans and percentage of population with a disability between the ages 65 and 75 in the United States with a correlation coefficient (R) of 0.631 and weighted average of 23.3%. Similarly, the statistical analysis conducted on geographies consisting of 529,866,970 people shows a moderate positive correlation between the proportion of British and percentage of population with a disability between the ages 65 and 75 in the United States with a correlation coefficient (R) of 0.420 and weighted average of 23.0%, a difference of 1.3%.
Disability Age 65 to 74 Correlation Summary
| Measurement | Moroccan | British |
| Minimum | 11.0% | 10.0% |
| Maximum | 69.0% | 100.0% |
| Range | 58.0% | 90.0% |
| Mean | 26.6% | 38.7% |
| Median | 23.2% | 27.6% |
| Interquartile 25% (IQ1) | 20.6% | 21.6% |
| Interquartile 75% (IQ3) | 27.0% | 50.0% |
| Interquartile Range (IQR) | 6.4% | 28.4% |
| Standard Deviation (Sample) | 11.4% | 25.5% |
| Standard Deviation (Population) | 11.2% | 25.2% |
Demographics Similar to Moroccans and British by Disability Age 65 to 74
In terms of disability age 65 to 74, the demographic groups most similar to Moroccans are Icelander (23.3%, a difference of 0.010%), Cuban (23.3%, a difference of 0.13%), Pakistani (23.2%, a difference of 0.16%), Immigrants from Bosnia and Herzegovina (23.2%, a difference of 0.20%), and German (23.3%, a difference of 0.22%). Similarly, the demographic groups most similar to British are Sri Lankan (23.0%, a difference of 0.010%), Immigrants from Western Asia (23.0%, a difference of 0.010%), Slavic (23.0%, a difference of 0.10%), Czechoslovakian (23.0%, a difference of 0.11%), and Finnish (22.9%, a difference of 0.21%).
| Demographics | Rating | Rank | Disability Age 65 to 74 |
| Finns | 76.5 /100 | #152 | Good 22.9% |
| Slavs | 75.2 /100 | #153 | Good 23.0% |
| Sri Lankans | 74.0 /100 | #154 | Good 23.0% |
| British | 73.9 /100 | #155 | Good 23.0% |
| Immigrants | Western Asia | 73.8 /100 | #156 | Good 23.0% |
| Czechoslovakians | 72.4 /100 | #157 | Good 23.0% |
| Immigrants | Vietnam | 69.1 /100 | #158 | Good 23.1% |
| South American Indians | 65.5 /100 | #159 | Good 23.1% |
| Koreans | 64.2 /100 | #160 | Good 23.1% |
| Immigrants | Cameroon | 63.8 /100 | #161 | Good 23.1% |
| Europeans | 61.2 /100 | #162 | Good 23.2% |
| Immigrants | Philippines | 61.1 /100 | #163 | Good 23.2% |
| Sierra Leoneans | 60.9 /100 | #164 | Good 23.2% |
| Vietnamese | 60.8 /100 | #165 | Good 23.2% |
| Immigrants | Afghanistan | 60.5 /100 | #166 | Good 23.2% |
| Immigrants | Bosnia and Herzegovina | 57.6 /100 | #167 | Average 23.2% |
| Pakistanis | 57.0 /100 | #168 | Average 23.2% |
| Icelanders | 54.3 /100 | #169 | Average 23.3% |
| Moroccans | 54.2 /100 | #170 | Average 23.3% |
| Cubans | 51.9 /100 | #171 | Average 23.3% |
| Germans | 50.5 /100 | #172 | Average 23.3% |