Native/Alaskan vs Swedish Disability Age 65 to 74
COMPARE
Native/Alaskan
Swedish
Disability Age 65 to 74
Disability Age 65 to 74 Comparison
Natives/Alaskans
Swedes
30.4%
DISABILITY AGE 65 TO 74
0.0/ 100
METRIC RATING
332nd/ 347
METRIC RANK
22.4%
DISABILITY AGE 65 TO 74
94.7/ 100
METRIC RATING
117th/ 347
METRIC RANK
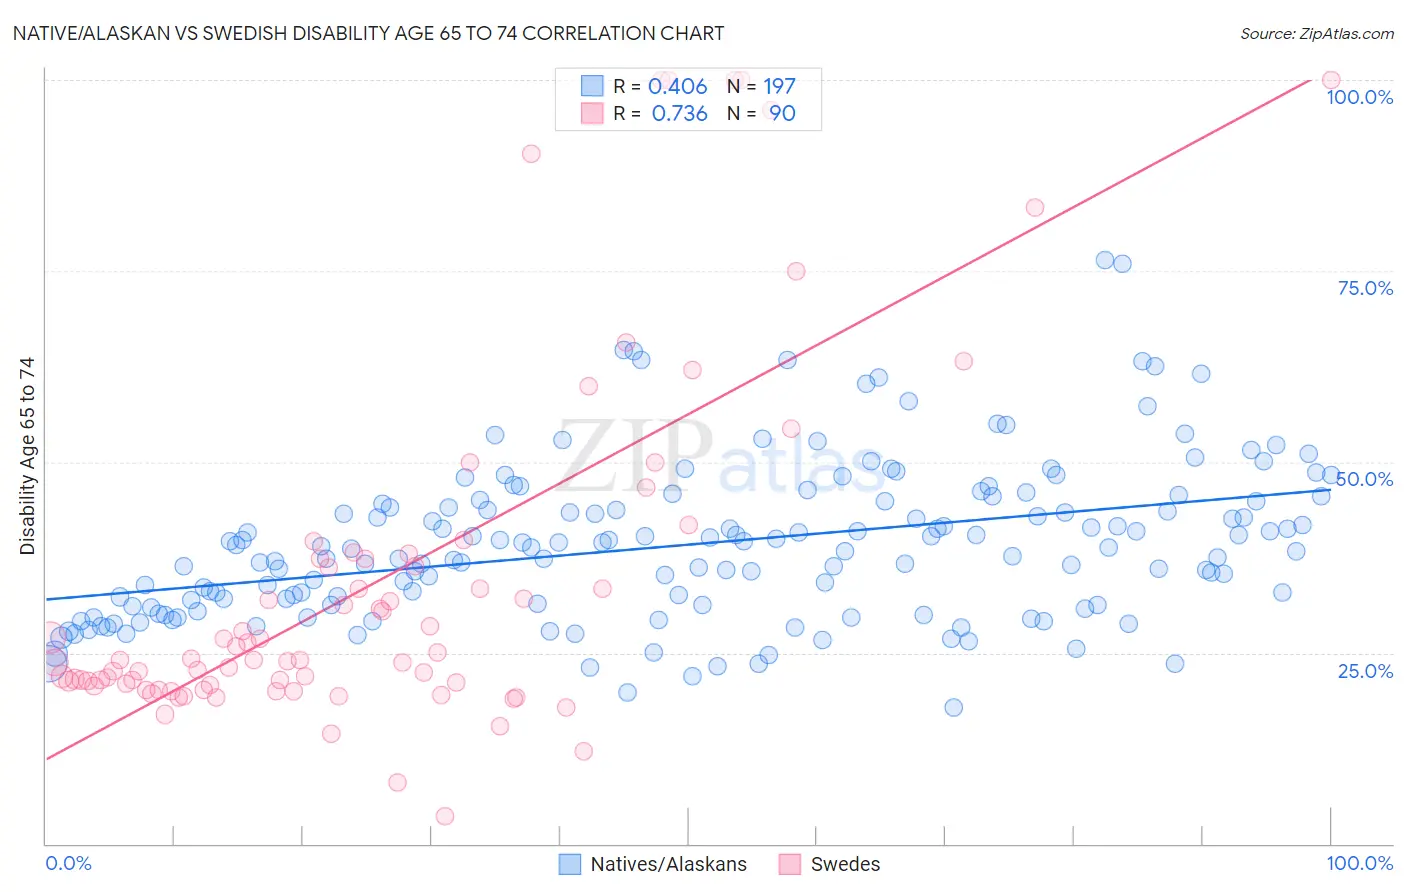
Native/Alaskan vs Swedish Disability Age 65 to 74 Correlation Chart
The statistical analysis conducted on geographies consisting of 511,555,776 people shows a moderate positive correlation between the proportion of Natives/Alaskans and percentage of population with a disability between the ages 65 and 75 in the United States with a correlation coefficient (R) of 0.406 and weighted average of 30.4%. Similarly, the statistical analysis conducted on geographies consisting of 537,372,214 people shows a strong positive correlation between the proportion of Swedes and percentage of population with a disability between the ages 65 and 75 in the United States with a correlation coefficient (R) of 0.736 and weighted average of 22.4%, a difference of 35.9%.
Disability Age 65 to 74 Correlation Summary
| Measurement | Native/Alaskan | Swedish |
| Minimum | 17.9% | 3.7% |
| Maximum | 76.4% | 100.0% |
| Range | 58.5% | 96.3% |
| Mean | 39.2% | 34.3% |
| Median | 38.6% | 24.0% |
| Interquartile 25% (IQ1) | 31.2% | 20.8% |
| Interquartile 75% (IQ3) | 44.7% | 37.4% |
| Interquartile Range (IQR) | 13.4% | 16.6% |
| Standard Deviation (Sample) | 10.3% | 23.2% |
| Standard Deviation (Population) | 10.3% | 23.0% |
Similar Demographics by Disability Age 65 to 74
Demographics Similar to Natives/Alaskans by Disability Age 65 to 74
In terms of disability age 65 to 74, the demographic groups most similar to Natives/Alaskans are Colville (30.5%, a difference of 0.52%), Chickasaw (30.2%, a difference of 0.62%), Creek (30.2%, a difference of 0.63%), Choctaw (30.2%, a difference of 0.66%), and Alaska Native (30.6%, a difference of 0.77%).
| Demographics | Rating | Rank | Disability Age 65 to 74 |
| Dutch West Indians | 0.0 /100 | #325 | Tragic 29.6% |
| Yakama | 0.0 /100 | #326 | Tragic 29.6% |
| Apache | 0.0 /100 | #327 | Tragic 29.7% |
| Hopi | 0.0 /100 | #328 | Tragic 30.0% |
| Choctaw | 0.0 /100 | #329 | Tragic 30.2% |
| Creek | 0.0 /100 | #330 | Tragic 30.2% |
| Chickasaw | 0.0 /100 | #331 | Tragic 30.2% |
| Natives/Alaskans | 0.0 /100 | #332 | Tragic 30.4% |
| Colville | 0.0 /100 | #333 | Tragic 30.5% |
| Alaska Natives | 0.0 /100 | #334 | Tragic 30.6% |
| Cheyenne | 0.0 /100 | #335 | Tragic 31.1% |
| Yuman | 0.0 /100 | #336 | Tragic 31.5% |
| Houma | 0.0 /100 | #337 | Tragic 32.3% |
| Alaskan Athabascans | 0.0 /100 | #338 | Tragic 32.4% |
| Kiowa | 0.0 /100 | #339 | Tragic 32.6% |
Demographics Similar to Swedes by Disability Age 65 to 74
In terms of disability age 65 to 74, the demographic groups most similar to Swedes are Austrian (22.4%, a difference of 0.0%), Brazilian (22.4%, a difference of 0.010%), Immigrants from Northern Africa (22.4%, a difference of 0.010%), Laotian (22.3%, a difference of 0.050%), and Ukrainian (22.3%, a difference of 0.12%).
| Demographics | Rating | Rank | Disability Age 65 to 74 |
| Immigrants | Peru | 95.7 /100 | #110 | Exceptional 22.3% |
| Serbians | 95.7 /100 | #111 | Exceptional 22.3% |
| Immigrants | South America | 95.5 /100 | #112 | Exceptional 22.3% |
| Syrians | 95.3 /100 | #113 | Exceptional 22.3% |
| Ukrainians | 95.1 /100 | #114 | Exceptional 22.3% |
| Laotians | 94.9 /100 | #115 | Exceptional 22.3% |
| Brazilians | 94.8 /100 | #116 | Exceptional 22.4% |
| Swedes | 94.7 /100 | #117 | Exceptional 22.4% |
| Austrians | 94.7 /100 | #118 | Exceptional 22.4% |
| Immigrants | Northern Africa | 94.7 /100 | #119 | Exceptional 22.4% |
| Immigrants | Kazakhstan | 93.9 /100 | #120 | Exceptional 22.4% |
| Czechs | 93.5 /100 | #121 | Exceptional 22.4% |
| Immigrants | Jordan | 93.5 /100 | #122 | Exceptional 22.4% |
| Hungarians | 93.3 /100 | #123 | Exceptional 22.4% |
| Norwegians | 92.5 /100 | #124 | Exceptional 22.5% |