Ugandan vs British Disability Age 65 to 74
COMPARE
Ugandan
British
Disability Age 65 to 74
Disability Age 65 to 74 Comparison
Ugandans
British
22.7%
DISABILITY AGE 65 TO 74
85.4/ 100
METRIC RATING
140th/ 347
METRIC RANK
23.0%
DISABILITY AGE 65 TO 74
73.9/ 100
METRIC RATING
155th/ 347
METRIC RANK
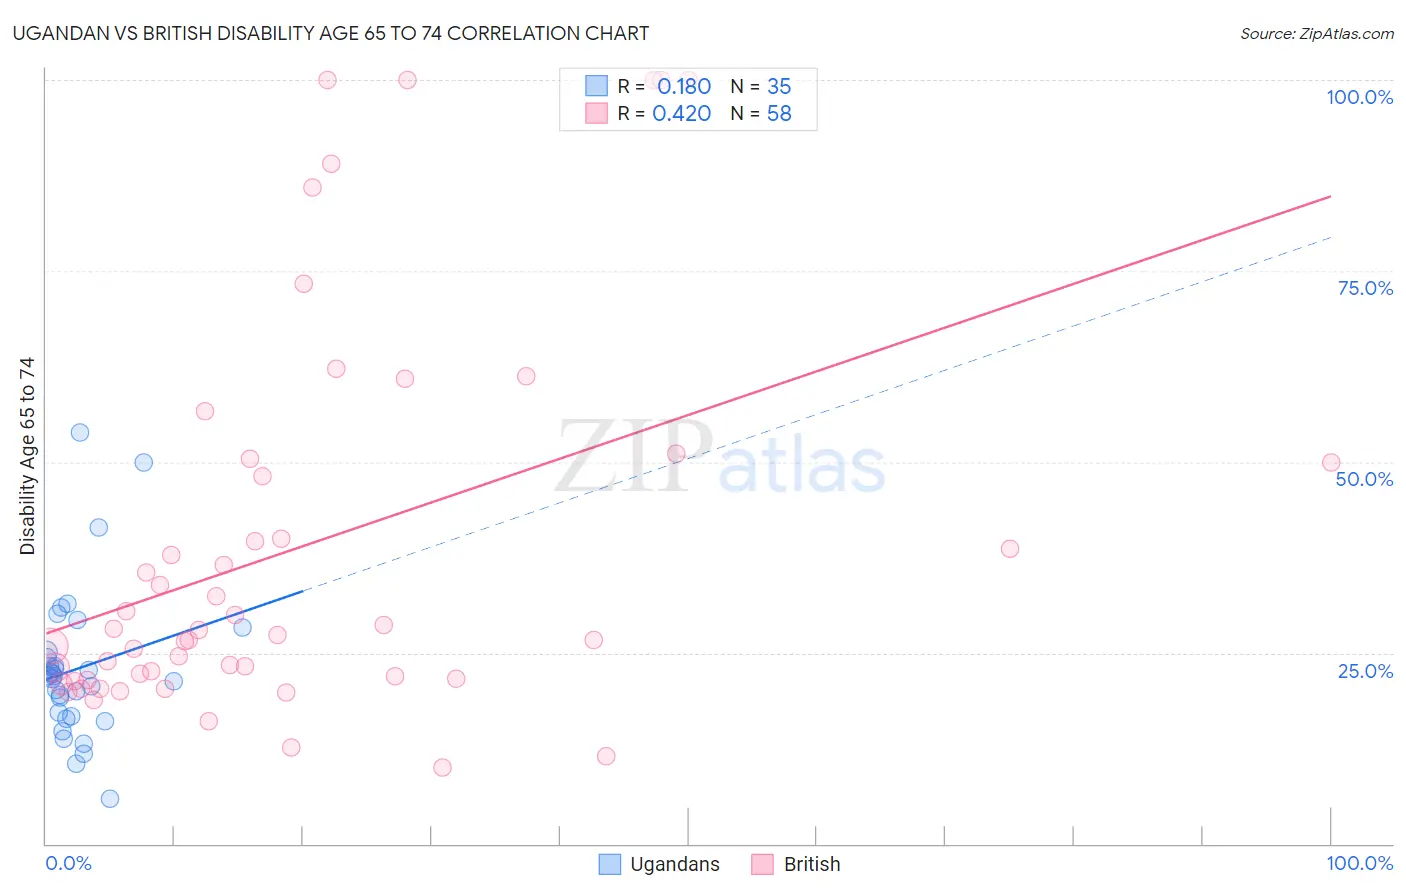
Ugandan vs British Disability Age 65 to 74 Correlation Chart
The statistical analysis conducted on geographies consisting of 93,935,891 people shows a poor positive correlation between the proportion of Ugandans and percentage of population with a disability between the ages 65 and 75 in the United States with a correlation coefficient (R) of 0.180 and weighted average of 22.7%. Similarly, the statistical analysis conducted on geographies consisting of 529,866,970 people shows a moderate positive correlation between the proportion of British and percentage of population with a disability between the ages 65 and 75 in the United States with a correlation coefficient (R) of 0.420 and weighted average of 23.0%, a difference of 1.1%.
Disability Age 65 to 74 Correlation Summary
| Measurement | Ugandan | British |
| Minimum | 5.9% | 10.0% |
| Maximum | 53.8% | 100.0% |
| Range | 48.0% | 90.0% |
| Mean | 23.0% | 38.7% |
| Median | 21.9% | 27.6% |
| Interquartile 25% (IQ1) | 16.7% | 21.6% |
| Interquartile 75% (IQ3) | 25.1% | 50.0% |
| Interquartile Range (IQR) | 8.4% | 28.4% |
| Standard Deviation (Sample) | 9.9% | 25.5% |
| Standard Deviation (Population) | 9.8% | 25.2% |
Demographics Similar to Ugandans and British by Disability Age 65 to 74
In terms of disability age 65 to 74, the demographic groups most similar to Ugandans are Belgian (22.7%, a difference of 0.010%), Immigrants from Ethiopia (22.7%, a difference of 0.020%), Immigrants from Syria (22.7%, a difference of 0.040%), Arab (22.8%, a difference of 0.080%), and Danish (22.8%, a difference of 0.12%). Similarly, the demographic groups most similar to British are Sri Lankan (23.0%, a difference of 0.010%), Immigrants from Western Asia (23.0%, a difference of 0.010%), Slavic (23.0%, a difference of 0.10%), Czechoslovakian (23.0%, a difference of 0.11%), and Finnish (22.9%, a difference of 0.21%).
| Demographics | Rating | Rank | Disability Age 65 to 74 |
| Taiwanese | 87.6 /100 | #137 | Excellent 22.7% |
| Immigrants | Moldova | 87.3 /100 | #138 | Excellent 22.7% |
| Immigrants | Syria | 85.8 /100 | #139 | Excellent 22.7% |
| Ugandans | 85.4 /100 | #140 | Excellent 22.7% |
| Belgians | 85.3 /100 | #141 | Excellent 22.7% |
| Immigrants | Ethiopia | 85.3 /100 | #142 | Excellent 22.7% |
| Arabs | 84.8 /100 | #143 | Excellent 22.8% |
| Danes | 84.4 /100 | #144 | Excellent 22.8% |
| Immigrants | Uganda | 84.0 /100 | #145 | Excellent 22.8% |
| Alsatians | 83.7 /100 | #146 | Excellent 22.8% |
| Immigrants | Uzbekistan | 83.1 /100 | #147 | Excellent 22.8% |
| New Zealanders | 79.9 /100 | #148 | Good 22.9% |
| Swiss | 79.7 /100 | #149 | Good 22.9% |
| Canadians | 77.7 /100 | #150 | Good 22.9% |
| Immigrants | Morocco | 77.6 /100 | #151 | Good 22.9% |
| Finns | 76.5 /100 | #152 | Good 22.9% |
| Slavs | 75.2 /100 | #153 | Good 23.0% |
| Sri Lankans | 74.0 /100 | #154 | Good 23.0% |
| British | 73.9 /100 | #155 | Good 23.0% |
| Immigrants | Western Asia | 73.8 /100 | #156 | Good 23.0% |
| Czechoslovakians | 72.4 /100 | #157 | Good 23.0% |