Native/Alaskan vs Cree Disability Age 65 to 74
COMPARE
Native/Alaskan
Cree
Disability Age 65 to 74
Disability Age 65 to 74 Comparison
Natives/Alaskans
Cree
30.4%
DISABILITY AGE 65 TO 74
0.0/ 100
METRIC RATING
332nd/ 347
METRIC RANK
25.9%
DISABILITY AGE 65 TO 74
0.1/ 100
METRIC RATING
280th/ 347
METRIC RANK
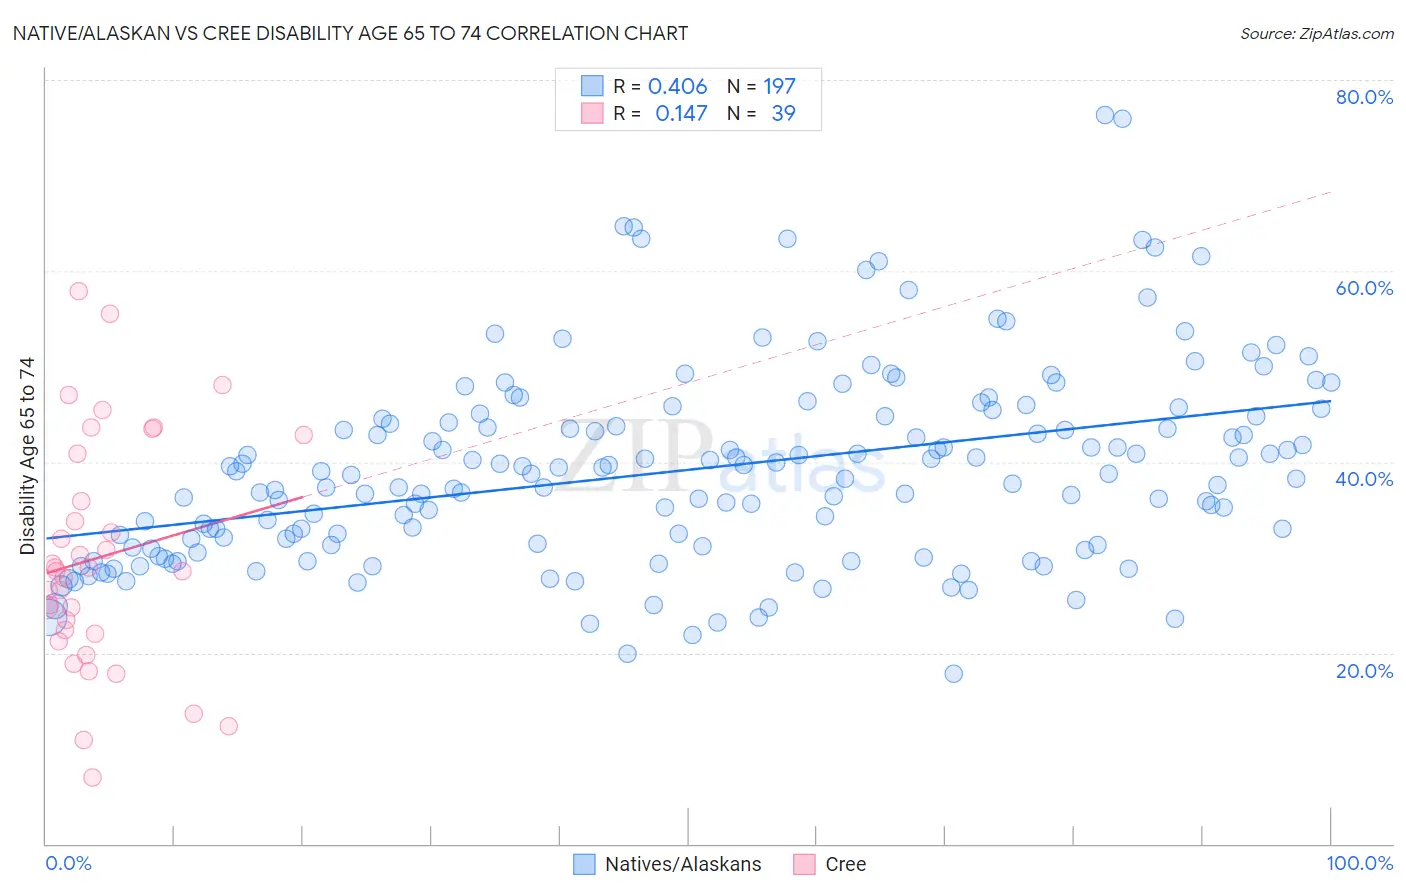
Native/Alaskan vs Cree Disability Age 65 to 74 Correlation Chart
The statistical analysis conducted on geographies consisting of 511,555,776 people shows a moderate positive correlation between the proportion of Natives/Alaskans and percentage of population with a disability between the ages 65 and 75 in the United States with a correlation coefficient (R) of 0.406 and weighted average of 30.4%. Similarly, the statistical analysis conducted on geographies consisting of 76,196,128 people shows a poor positive correlation between the proportion of Cree and percentage of population with a disability between the ages 65 and 75 in the United States with a correlation coefficient (R) of 0.147 and weighted average of 25.9%, a difference of 17.4%.
Disability Age 65 to 74 Correlation Summary
| Measurement | Native/Alaskan | Cree |
| Minimum | 17.9% | 7.0% |
| Maximum | 76.4% | 57.9% |
| Range | 58.5% | 50.9% |
| Mean | 39.2% | 30.0% |
| Median | 38.6% | 28.6% |
| Interquartile 25% (IQ1) | 31.2% | 22.0% |
| Interquartile 75% (IQ3) | 44.7% | 40.9% |
| Interquartile Range (IQR) | 13.4% | 18.9% |
| Standard Deviation (Sample) | 10.3% | 12.1% |
| Standard Deviation (Population) | 10.3% | 11.9% |
Similar Demographics by Disability Age 65 to 74
Demographics Similar to Natives/Alaskans by Disability Age 65 to 74
In terms of disability age 65 to 74, the demographic groups most similar to Natives/Alaskans are Colville (30.5%, a difference of 0.52%), Chickasaw (30.2%, a difference of 0.62%), Creek (30.2%, a difference of 0.63%), Choctaw (30.2%, a difference of 0.66%), and Alaska Native (30.6%, a difference of 0.77%).
| Demographics | Rating | Rank | Disability Age 65 to 74 |
| Dutch West Indians | 0.0 /100 | #325 | Tragic 29.6% |
| Yakama | 0.0 /100 | #326 | Tragic 29.6% |
| Apache | 0.0 /100 | #327 | Tragic 29.7% |
| Hopi | 0.0 /100 | #328 | Tragic 30.0% |
| Choctaw | 0.0 /100 | #329 | Tragic 30.2% |
| Creek | 0.0 /100 | #330 | Tragic 30.2% |
| Chickasaw | 0.0 /100 | #331 | Tragic 30.2% |
| Natives/Alaskans | 0.0 /100 | #332 | Tragic 30.4% |
| Colville | 0.0 /100 | #333 | Tragic 30.5% |
| Alaska Natives | 0.0 /100 | #334 | Tragic 30.6% |
| Cheyenne | 0.0 /100 | #335 | Tragic 31.1% |
| Yuman | 0.0 /100 | #336 | Tragic 31.5% |
| Houma | 0.0 /100 | #337 | Tragic 32.3% |
| Alaskan Athabascans | 0.0 /100 | #338 | Tragic 32.4% |
| Kiowa | 0.0 /100 | #339 | Tragic 32.6% |
Demographics Similar to Cree by Disability Age 65 to 74
In terms of disability age 65 to 74, the demographic groups most similar to Cree are Immigrants from Honduras (25.9%, a difference of 0.020%), U.S. Virgin Islander (25.9%, a difference of 0.080%), Delaware (25.9%, a difference of 0.090%), Immigrants from Belize (25.8%, a difference of 0.16%), and Belizean (25.8%, a difference of 0.18%).
| Demographics | Rating | Rank | Disability Age 65 to 74 |
| Japanese | 0.1 /100 | #273 | Tragic 25.7% |
| Americans | 0.1 /100 | #274 | Tragic 25.8% |
| Hondurans | 0.1 /100 | #275 | Tragic 25.8% |
| French American Indians | 0.1 /100 | #276 | Tragic 25.8% |
| Belizeans | 0.1 /100 | #277 | Tragic 25.8% |
| Immigrants | Belize | 0.1 /100 | #278 | Tragic 25.8% |
| U.S. Virgin Islanders | 0.1 /100 | #279 | Tragic 25.9% |
| Cree | 0.1 /100 | #280 | Tragic 25.9% |
| Immigrants | Honduras | 0.1 /100 | #281 | Tragic 25.9% |
| Delaware | 0.1 /100 | #282 | Tragic 25.9% |
| Spanish Americans | 0.0 /100 | #283 | Tragic 25.9% |
| Immigrants | Azores | 0.0 /100 | #284 | Tragic 26.0% |
| Immigrants | Congo | 0.0 /100 | #285 | Tragic 26.0% |
| Immigrants | Micronesia | 0.0 /100 | #286 | Tragic 26.1% |
| Immigrants | Laos | 0.0 /100 | #287 | Tragic 26.1% |