Native/Alaskan vs Australian Seniors Poverty Over the Age of 65
COMPARE
Native/Alaskan
Australian
Seniors Poverty Over the Age of 65
Seniors Poverty Over the Age of 65 Comparison
Natives/Alaskans
Australians
14.2%
SENIORS POVERTY OVER THE AGE OF 65
0.0/ 100
METRIC RATING
311th/ 347
METRIC RANK
9.9%
SENIORS POVERTY OVER THE AGE OF 65
98.4/ 100
METRIC RATING
69th/ 347
METRIC RANK
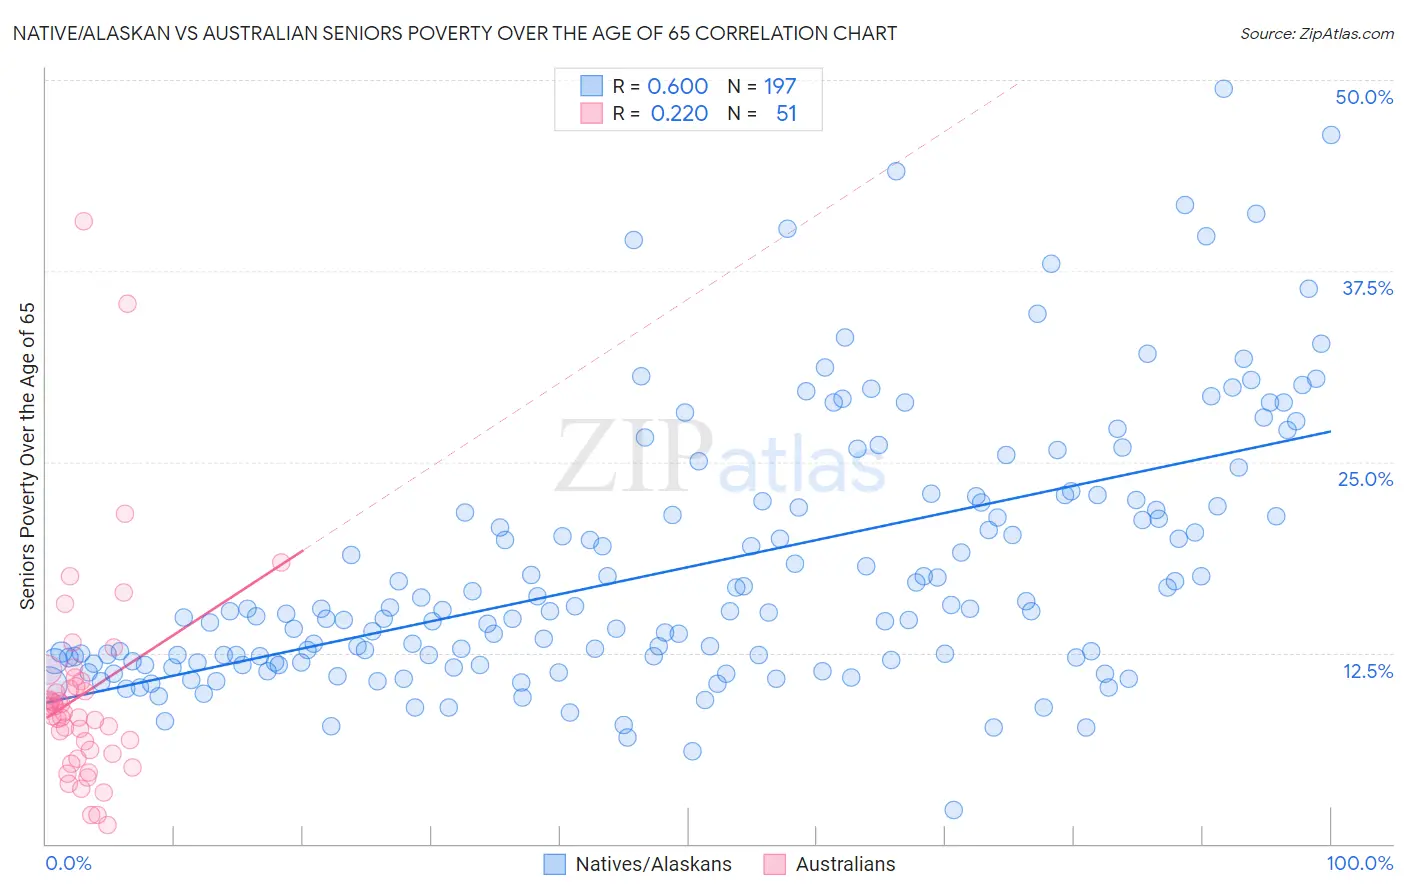
Native/Alaskan vs Australian Seniors Poverty Over the Age of 65 Correlation Chart
The statistical analysis conducted on geographies consisting of 510,101,075 people shows a substantial positive correlation between the proportion of Natives/Alaskans and poverty level among seniors over the age of 65 in the United States with a correlation coefficient (R) of 0.600 and weighted average of 14.2%. Similarly, the statistical analysis conducted on geographies consisting of 223,667,118 people shows a weak positive correlation between the proportion of Australians and poverty level among seniors over the age of 65 in the United States with a correlation coefficient (R) of 0.220 and weighted average of 9.9%, a difference of 43.3%.
Seniors Poverty Over the Age of 65 Correlation Summary
| Measurement | Native/Alaskan | Australian |
| Minimum | 2.2% | 1.2% |
| Maximum | 49.4% | 40.8% |
| Range | 47.2% | 39.6% |
| Mean | 18.1% | 9.8% |
| Median | 15.2% | 8.6% |
| Interquartile 25% (IQ1) | 11.9% | 5.9% |
| Interquartile 75% (IQ3) | 22.3% | 10.7% |
| Interquartile Range (IQR) | 10.4% | 4.8% |
| Standard Deviation (Sample) | 8.6% | 7.1% |
| Standard Deviation (Population) | 8.6% | 7.1% |
Similar Demographics by Seniors Poverty Over the Age of 65
Demographics Similar to Natives/Alaskans by Seniors Poverty Over the Age of 65
In terms of seniors poverty over the age of 65, the demographic groups most similar to Natives/Alaskans are Bahamian (14.2%, a difference of 0.010%), Honduran (14.2%, a difference of 0.27%), Trinidadian and Tobagonian (14.2%, a difference of 0.36%), Immigrants from West Indies (14.2%, a difference of 0.44%), and Hispanic or Latino (14.3%, a difference of 0.54%).
| Demographics | Rating | Rank | Seniors Poverty Over the Age of 65 |
| West Indians | 0.0 /100 | #304 | Tragic 14.1% |
| Immigrants | Trinidad and Tobago | 0.0 /100 | #305 | Tragic 14.1% |
| Immigrants | Latin America | 0.0 /100 | #306 | Tragic 14.2% |
| Immigrants | West Indies | 0.0 /100 | #307 | Tragic 14.2% |
| Trinidadians and Tobagonians | 0.0 /100 | #308 | Tragic 14.2% |
| Hondurans | 0.0 /100 | #309 | Tragic 14.2% |
| Bahamians | 0.0 /100 | #310 | Tragic 14.2% |
| Natives/Alaskans | 0.0 /100 | #311 | Tragic 14.2% |
| Hispanics or Latinos | 0.0 /100 | #312 | Tragic 14.3% |
| Barbadians | 0.0 /100 | #313 | Tragic 14.4% |
| Guyanese | 0.0 /100 | #314 | Tragic 14.4% |
| Immigrants | Ecuador | 0.0 /100 | #315 | Tragic 14.4% |
| Immigrants | Guyana | 0.0 /100 | #316 | Tragic 14.5% |
| Haitians | 0.0 /100 | #317 | Tragic 14.5% |
| Immigrants | Honduras | 0.0 /100 | #318 | Tragic 14.5% |
Demographics Similar to Australians by Seniors Poverty Over the Age of 65
In terms of seniors poverty over the age of 65, the demographic groups most similar to Australians are Canadian (9.9%, a difference of 0.16%), Immigrants from Austria (9.9%, a difference of 0.37%), Immigrants from Netherlands (9.9%, a difference of 0.48%), Pennsylvania German (9.9%, a difference of 0.53%), and Samoan (10.0%, a difference of 0.57%).
| Demographics | Rating | Rank | Seniors Poverty Over the Age of 65 |
| French Canadians | 98.9 /100 | #62 | Exceptional 9.8% |
| Macedonians | 98.8 /100 | #63 | Exceptional 9.9% |
| Immigrants | North America | 98.8 /100 | #64 | Exceptional 9.9% |
| Pennsylvania Germans | 98.7 /100 | #65 | Exceptional 9.9% |
| Immigrants | Netherlands | 98.7 /100 | #66 | Exceptional 9.9% |
| Immigrants | Austria | 98.6 /100 | #67 | Exceptional 9.9% |
| Canadians | 98.5 /100 | #68 | Exceptional 9.9% |
| Australians | 98.4 /100 | #69 | Exceptional 9.9% |
| Samoans | 98.0 /100 | #70 | Exceptional 10.0% |
| Yugoslavians | 97.9 /100 | #71 | Exceptional 10.0% |
| Palestinians | 97.9 /100 | #72 | Exceptional 10.0% |
| Russians | 97.9 /100 | #73 | Exceptional 10.0% |
| Turks | 97.9 /100 | #74 | Exceptional 10.0% |
| Immigrants | Czechoslovakia | 97.8 /100 | #75 | Exceptional 10.0% |
| New Zealanders | 97.7 /100 | #76 | Exceptional 10.0% |