Assyrian/Chaldean/Syriac vs Arab Disability Age 35 to 64
COMPARE
Assyrian/Chaldean/Syriac
Arab
Disability Age 35 to 64
Disability Age 35 to 64 Comparison
Assyrians/Chaldeans/Syriacs
Arabs
10.5%
DISABILITY AGE 35 TO 64
96.8/ 100
METRIC RATING
112th/ 347
METRIC RANK
10.9%
DISABILITY AGE 35 TO 64
82.7/ 100
METRIC RATING
148th/ 347
METRIC RANK
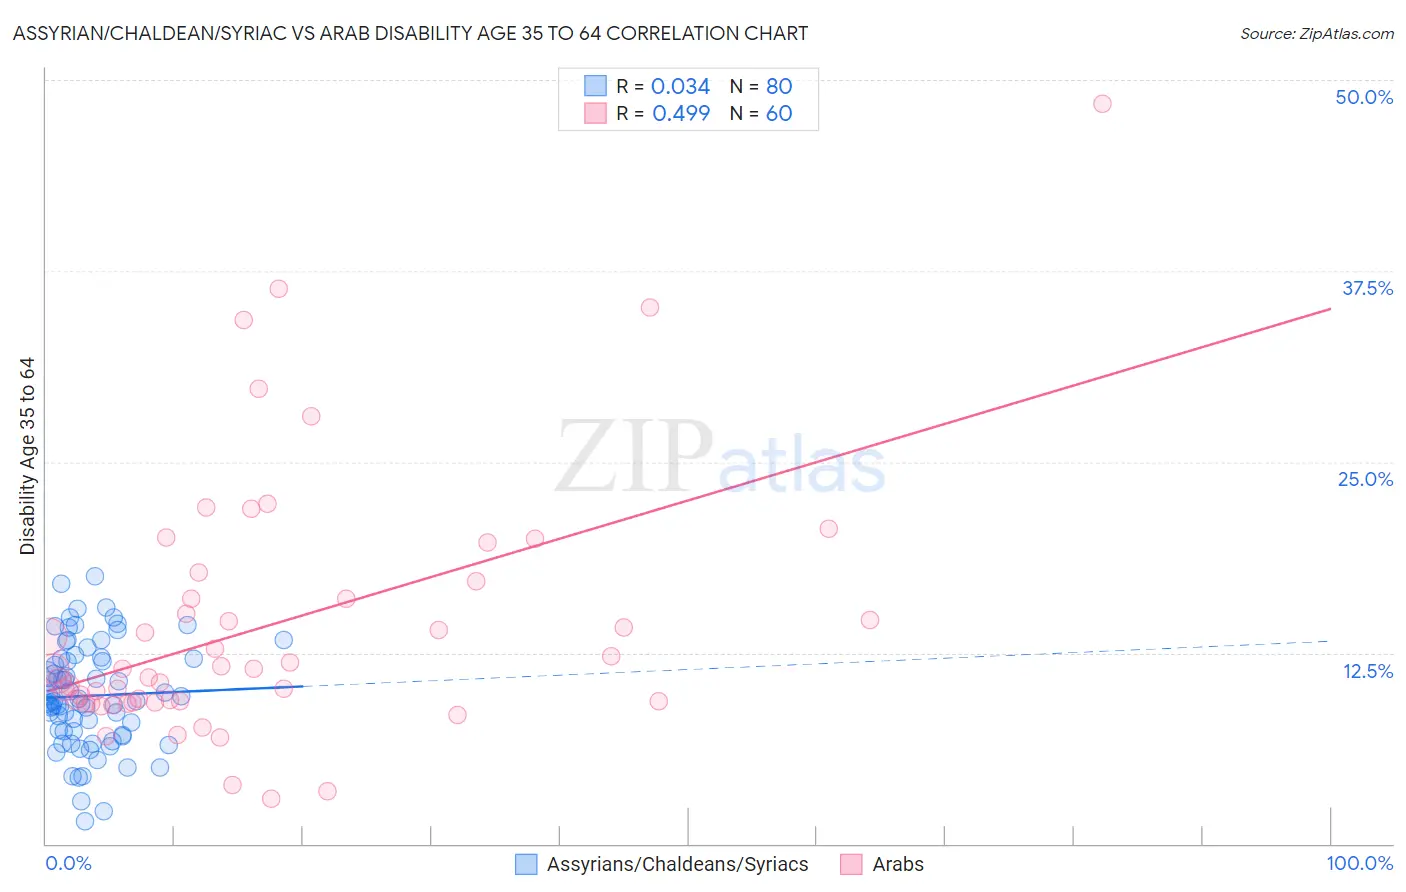
Assyrian/Chaldean/Syriac vs Arab Disability Age 35 to 64 Correlation Chart
The statistical analysis conducted on geographies consisting of 110,296,626 people shows no correlation between the proportion of Assyrians/Chaldeans/Syriacs and percentage of population with a disability between the ages 34 and 64 in the United States with a correlation coefficient (R) of 0.034 and weighted average of 10.5%. Similarly, the statistical analysis conducted on geographies consisting of 486,294,602 people shows a moderate positive correlation between the proportion of Arabs and percentage of population with a disability between the ages 34 and 64 in the United States with a correlation coefficient (R) of 0.499 and weighted average of 10.9%, a difference of 4.0%.
Disability Age 35 to 64 Correlation Summary
| Measurement | Assyrian/Chaldean/Syriac | Arab |
| Minimum | 1.5% | 2.9% |
| Maximum | 17.5% | 48.5% |
| Range | 16.0% | 45.5% |
| Mean | 9.7% | 14.3% |
| Median | 9.4% | 11.4% |
| Interquartile 25% (IQ1) | 7.2% | 9.3% |
| Interquartile 75% (IQ3) | 12.1% | 16.6% |
| Interquartile Range (IQR) | 4.9% | 7.4% |
| Standard Deviation (Sample) | 3.4% | 8.6% |
| Standard Deviation (Population) | 3.4% | 8.5% |
Similar Demographics by Disability Age 35 to 64
Demographics Similar to Assyrians/Chaldeans/Syriacs by Disability Age 35 to 64
In terms of disability age 35 to 64, the demographic groups most similar to Assyrians/Chaldeans/Syriacs are Brazilian (10.5%, a difference of 0.030%), Tongan (10.5%, a difference of 0.12%), Immigrants from Morocco (10.5%, a difference of 0.17%), Korean (10.5%, a difference of 0.24%), and Immigrants from Ethiopia (10.5%, a difference of 0.30%).
| Demographics | Rating | Rank | Disability Age 35 to 64 |
| Macedonians | 97.8 /100 | #105 | Exceptional 10.4% |
| Immigrants | Hungary | 97.6 /100 | #106 | Exceptional 10.4% |
| Zimbabweans | 97.4 /100 | #107 | Exceptional 10.4% |
| Ethiopians | 97.4 /100 | #108 | Exceptional 10.5% |
| Immigrants | Ethiopia | 97.2 /100 | #109 | Exceptional 10.5% |
| Koreans | 97.1 /100 | #110 | Exceptional 10.5% |
| Brazilians | 96.9 /100 | #111 | Exceptional 10.5% |
| Assyrians/Chaldeans/Syriacs | 96.8 /100 | #112 | Exceptional 10.5% |
| Tongans | 96.6 /100 | #113 | Exceptional 10.5% |
| Immigrants | Morocco | 96.6 /100 | #114 | Exceptional 10.5% |
| Immigrants | Netherlands | 96.3 /100 | #115 | Exceptional 10.5% |
| Immigrants | Nepal | 95.9 /100 | #116 | Exceptional 10.6% |
| Immigrants | South Eastern Asia | 95.7 /100 | #117 | Exceptional 10.6% |
| Immigrants | Moldova | 95.5 /100 | #118 | Exceptional 10.6% |
| Luxembourgers | 95.5 /100 | #119 | Exceptional 10.6% |
Demographics Similar to Arabs by Disability Age 35 to 64
In terms of disability age 35 to 64, the demographic groups most similar to Arabs are Immigrants from Eritrea (10.9%, a difference of 0.10%), South American Indian (10.9%, a difference of 0.12%), Immigrants from Cameroon (10.9%, a difference of 0.22%), Syrian (11.0%, a difference of 0.40%), and Immigrants from Bangladesh (10.9%, a difference of 0.45%).
| Demographics | Rating | Rank | Disability Age 35 to 64 |
| Australians | 90.7 /100 | #141 | Exceptional 10.8% |
| Immigrants | Saudi Arabia | 90.6 /100 | #142 | Exceptional 10.8% |
| Sierra Leoneans | 89.7 /100 | #143 | Excellent 10.8% |
| Lithuanians | 88.7 /100 | #144 | Excellent 10.8% |
| Immigrants | Bangladesh | 85.6 /100 | #145 | Excellent 10.9% |
| South American Indians | 83.5 /100 | #146 | Excellent 10.9% |
| Immigrants | Eritrea | 83.4 /100 | #147 | Excellent 10.9% |
| Arabs | 82.7 /100 | #148 | Excellent 10.9% |
| Immigrants | Cameroon | 81.1 /100 | #149 | Excellent 10.9% |
| Syrians | 79.8 /100 | #150 | Good 11.0% |
| New Zealanders | 79.3 /100 | #151 | Good 11.0% |
| Ukrainians | 78.0 /100 | #152 | Good 11.0% |
| Immigrants | England | 77.4 /100 | #153 | Good 11.0% |
| Immigrants | Canada | 76.7 /100 | #154 | Good 11.0% |
| Moroccans | 76.4 /100 | #155 | Good 11.0% |