Native/Alaskan vs Arab Professional Degree
COMPARE
Native/Alaskan
Arab
Professional Degree
Professional Degree Comparison
Natives/Alaskans
Arabs
3.0%
PROFESSIONAL DEGREE
0.0/ 100
METRIC RATING
335th/ 347
METRIC RANK
5.0%
PROFESSIONAL DEGREE
98.2/ 100
METRIC RATING
104th/ 347
METRIC RANK
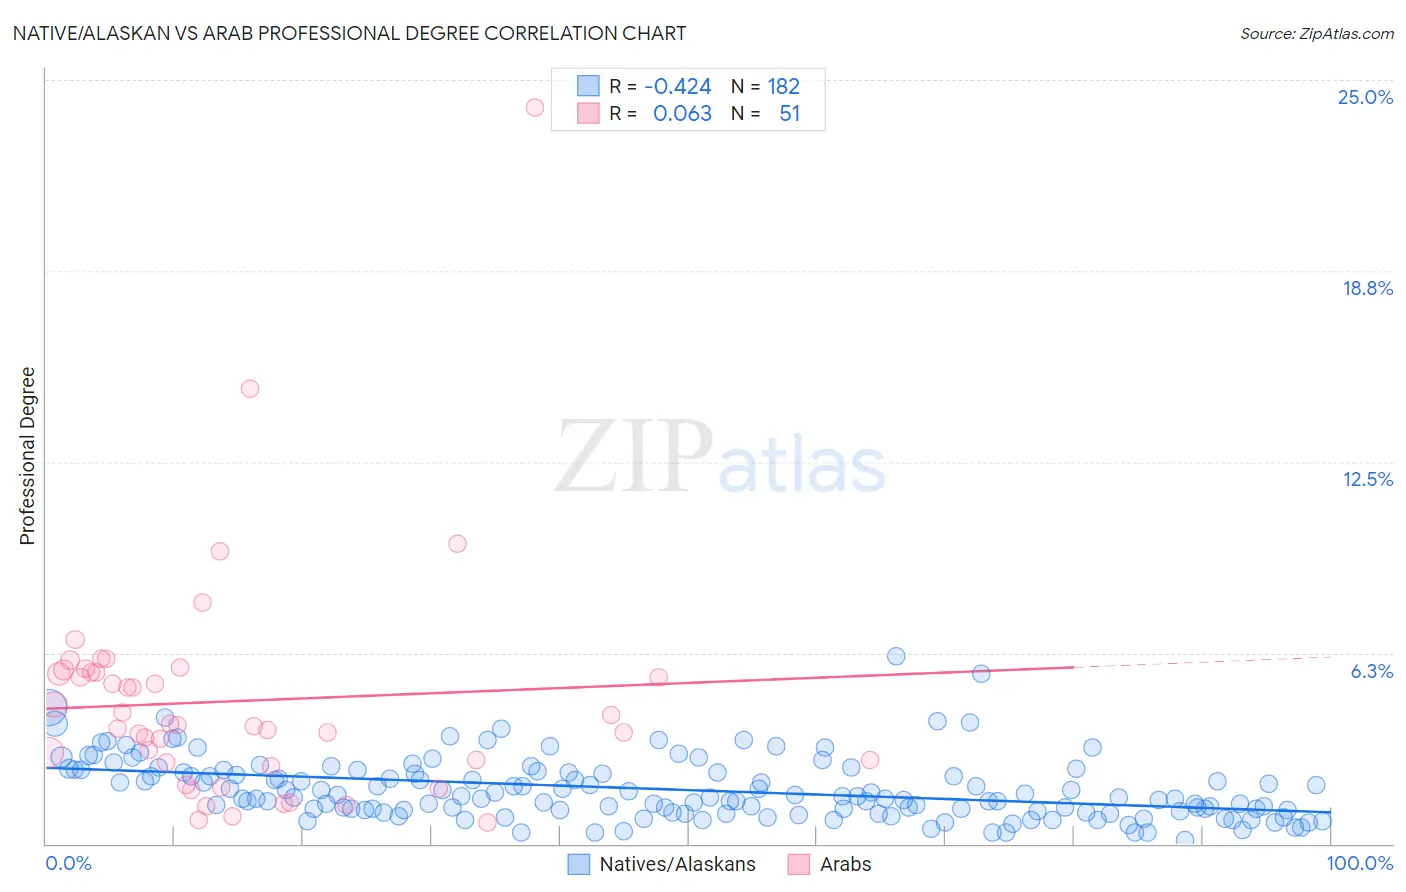
Native/Alaskan vs Arab Professional Degree Correlation Chart
The statistical analysis conducted on geographies consisting of 508,142,680 people shows a moderate negative correlation between the proportion of Natives/Alaskans and percentage of population with at least professional degree education in the United States with a correlation coefficient (R) of -0.424 and weighted average of 3.0%. Similarly, the statistical analysis conducted on geographies consisting of 485,125,544 people shows a slight positive correlation between the proportion of Arabs and percentage of population with at least professional degree education in the United States with a correlation coefficient (R) of 0.063 and weighted average of 5.0%, a difference of 70.7%.
Professional Degree Correlation Summary
| Measurement | Native/Alaskan | Arab |
| Minimum | 0.12% | 0.70% |
| Maximum | 6.1% | 24.1% |
| Range | 6.0% | 23.4% |
| Mean | 1.8% | 4.7% |
| Median | 1.5% | 3.9% |
| Interquartile 25% (IQ1) | 1.1% | 2.6% |
| Interquartile 75% (IQ3) | 2.3% | 5.6% |
| Interquartile Range (IQR) | 1.3% | 3.0% |
| Standard Deviation (Sample) | 1.0% | 3.8% |
| Standard Deviation (Population) | 1.0% | 3.7% |
Similar Demographics by Professional Degree
Demographics Similar to Natives/Alaskans by Professional Degree
In terms of professional degree, the demographic groups most similar to Natives/Alaskans are Pennsylvania German (3.0%, a difference of 0.56%), Fijian (2.9%, a difference of 1.0%), Arapaho (2.9%, a difference of 2.8%), Navajo (2.9%, a difference of 2.9%), and Immigrants from Central America (2.9%, a difference of 3.0%).
| Demographics | Rating | Rank | Professional Degree |
| Creek | 0.0 /100 | #328 | Tragic 3.1% |
| Bangladeshis | 0.0 /100 | #329 | Tragic 3.1% |
| Immigrants | Cabo Verde | 0.0 /100 | #330 | Tragic 3.1% |
| Kiowa | 0.0 /100 | #331 | Tragic 3.1% |
| Yakama | 0.0 /100 | #332 | Tragic 3.1% |
| Puget Sound Salish | 0.0 /100 | #333 | Tragic 3.1% |
| Pennsylvania Germans | 0.0 /100 | #334 | Tragic 3.0% |
| Natives/Alaskans | 0.0 /100 | #335 | Tragic 3.0% |
| Fijians | 0.0 /100 | #336 | Tragic 2.9% |
| Arapaho | 0.0 /100 | #337 | Tragic 2.9% |
| Navajo | 0.0 /100 | #338 | Tragic 2.9% |
| Immigrants | Central America | 0.0 /100 | #339 | Tragic 2.9% |
| Yup'ik | 0.0 /100 | #340 | Tragic 2.9% |
| Tohono O'odham | 0.0 /100 | #341 | Tragic 2.8% |
| Immigrants | Azores | 0.0 /100 | #342 | Tragic 2.8% |
Demographics Similar to Arabs by Professional Degree
In terms of professional degree, the demographic groups most similar to Arabs are Immigrants from Uganda (5.0%, a difference of 0.020%), Immigrants from Ukraine (5.0%, a difference of 0.050%), Maltese (5.0%, a difference of 0.17%), Immigrants from Southern Europe (5.0%, a difference of 0.21%), and British (5.0%, a difference of 0.23%).
| Demographics | Rating | Rank | Professional Degree |
| Syrians | 99.1 /100 | #97 | Exceptional 5.2% |
| Austrians | 99.1 /100 | #98 | Exceptional 5.2% |
| Immigrants | Italy | 99.1 /100 | #99 | Exceptional 5.2% |
| Ugandans | 98.8 /100 | #100 | Exceptional 5.1% |
| Immigrants | Egypt | 98.5 /100 | #101 | Exceptional 5.1% |
| Ukrainians | 98.5 /100 | #102 | Exceptional 5.1% |
| Immigrants | Northern Africa | 98.4 /100 | #103 | Exceptional 5.1% |
| Arabs | 98.2 /100 | #104 | Exceptional 5.0% |
| Immigrants | Uganda | 98.2 /100 | #105 | Exceptional 5.0% |
| Immigrants | Ukraine | 98.2 /100 | #106 | Exceptional 5.0% |
| Maltese | 98.1 /100 | #107 | Exceptional 5.0% |
| Immigrants | Southern Europe | 98.1 /100 | #108 | Exceptional 5.0% |
| British | 98.0 /100 | #109 | Exceptional 5.0% |
| Lebanese | 98.0 /100 | #110 | Exceptional 5.0% |
| Brazilians | 97.4 /100 | #111 | Exceptional 5.0% |