Croatian vs Arab Disability Age 35 to 64
COMPARE
Croatian
Arab
Disability Age 35 to 64
Disability Age 35 to 64 Comparison
Croatians
Arabs
11.0%
DISABILITY AGE 35 TO 64
73.1/ 100
METRIC RATING
160th/ 347
METRIC RANK
10.9%
DISABILITY AGE 35 TO 64
82.7/ 100
METRIC RATING
148th/ 347
METRIC RANK
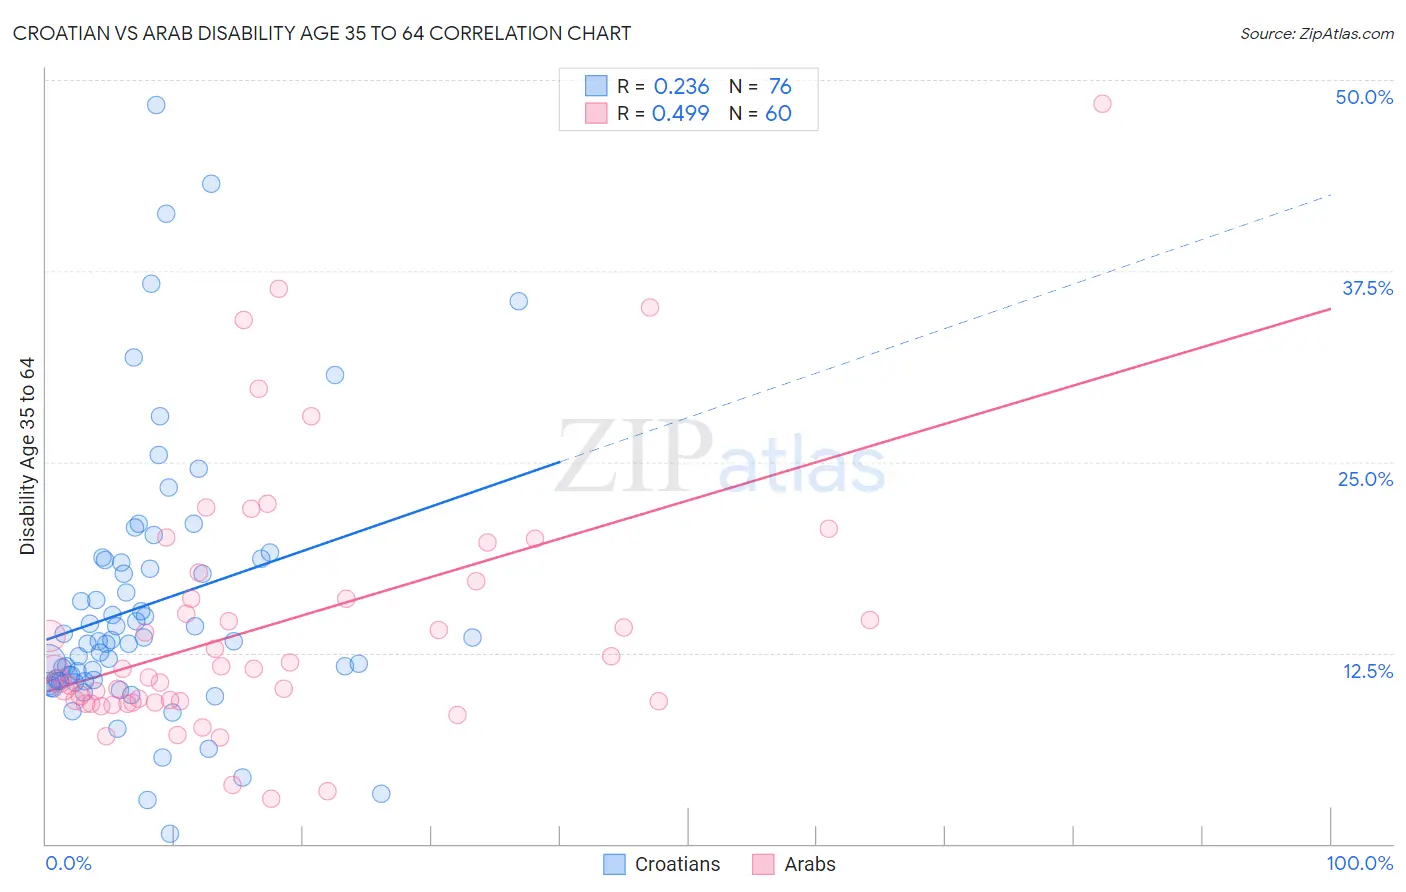
Croatian vs Arab Disability Age 35 to 64 Correlation Chart
The statistical analysis conducted on geographies consisting of 375,480,501 people shows a weak positive correlation between the proportion of Croatians and percentage of population with a disability between the ages 34 and 64 in the United States with a correlation coefficient (R) of 0.236 and weighted average of 11.0%. Similarly, the statistical analysis conducted on geographies consisting of 486,294,602 people shows a moderate positive correlation between the proportion of Arabs and percentage of population with a disability between the ages 34 and 64 in the United States with a correlation coefficient (R) of 0.499 and weighted average of 10.9%, a difference of 1.2%.
Disability Age 35 to 64 Correlation Summary
| Measurement | Croatian | Arab |
| Minimum | 0.68% | 2.9% |
| Maximum | 48.4% | 48.5% |
| Range | 47.7% | 45.5% |
| Mean | 15.7% | 14.3% |
| Median | 13.3% | 11.4% |
| Interquartile 25% (IQ1) | 10.6% | 9.3% |
| Interquartile 75% (IQ3) | 18.5% | 16.6% |
| Interquartile Range (IQR) | 7.8% | 7.4% |
| Standard Deviation (Sample) | 8.9% | 8.6% |
| Standard Deviation (Population) | 8.9% | 8.5% |
Demographics Similar to Croatians and Arabs by Disability Age 35 to 64
In terms of disability age 35 to 64, the demographic groups most similar to Croatians are Serbian (11.0%, a difference of 0.050%), Immigrants from North America (11.0%, a difference of 0.20%), Guyanese (11.0%, a difference of 0.21%), Immigrants from Guyana (11.1%, a difference of 0.30%), and Immigrants from Sierra Leone (11.0%, a difference of 0.34%). Similarly, the demographic groups most similar to Arabs are Immigrants from Eritrea (10.9%, a difference of 0.10%), South American Indian (10.9%, a difference of 0.12%), Immigrants from Cameroon (10.9%, a difference of 0.22%), Syrian (11.0%, a difference of 0.40%), and Immigrants from Bangladesh (10.9%, a difference of 0.45%).
| Demographics | Rating | Rank | Disability Age 35 to 64 |
| Lithuanians | 88.7 /100 | #144 | Excellent 10.8% |
| Immigrants | Bangladesh | 85.6 /100 | #145 | Excellent 10.9% |
| South American Indians | 83.5 /100 | #146 | Excellent 10.9% |
| Immigrants | Eritrea | 83.4 /100 | #147 | Excellent 10.9% |
| Arabs | 82.7 /100 | #148 | Excellent 10.9% |
| Immigrants | Cameroon | 81.1 /100 | #149 | Excellent 10.9% |
| Syrians | 79.8 /100 | #150 | Good 11.0% |
| New Zealanders | 79.3 /100 | #151 | Good 11.0% |
| Ukrainians | 78.0 /100 | #152 | Good 11.0% |
| Immigrants | England | 77.4 /100 | #153 | Good 11.0% |
| Immigrants | Canada | 76.7 /100 | #154 | Good 11.0% |
| Moroccans | 76.4 /100 | #155 | Good 11.0% |
| Immigrants | Sierra Leone | 76.2 /100 | #156 | Good 11.0% |
| Guyanese | 75.1 /100 | #157 | Good 11.0% |
| Immigrants | North America | 74.9 /100 | #158 | Good 11.0% |
| Serbians | 73.6 /100 | #159 | Good 11.0% |
| Croatians | 73.1 /100 | #160 | Good 11.0% |
| Immigrants | Guyana | 70.1 /100 | #161 | Good 11.1% |
| Immigrants | Grenada | 68.4 /100 | #162 | Good 11.1% |
| Immigrants | St. Vincent and the Grenadines | 66.6 /100 | #163 | Good 11.1% |
| Pakistanis | 65.8 /100 | #164 | Good 11.1% |