Immigrants from Sudan vs Marshallese Male Disability
COMPARE
Immigrants from Sudan
Marshallese
Male Disability
Male Disability Comparison
Immigrants from Sudan
Marshallese
11.0%
MALE DISABILITY
81.5/ 100
METRIC RATING
142nd/ 347
METRIC RANK
12.9%
MALE DISABILITY
0.0/ 100
METRIC RATING
294th/ 347
METRIC RANK
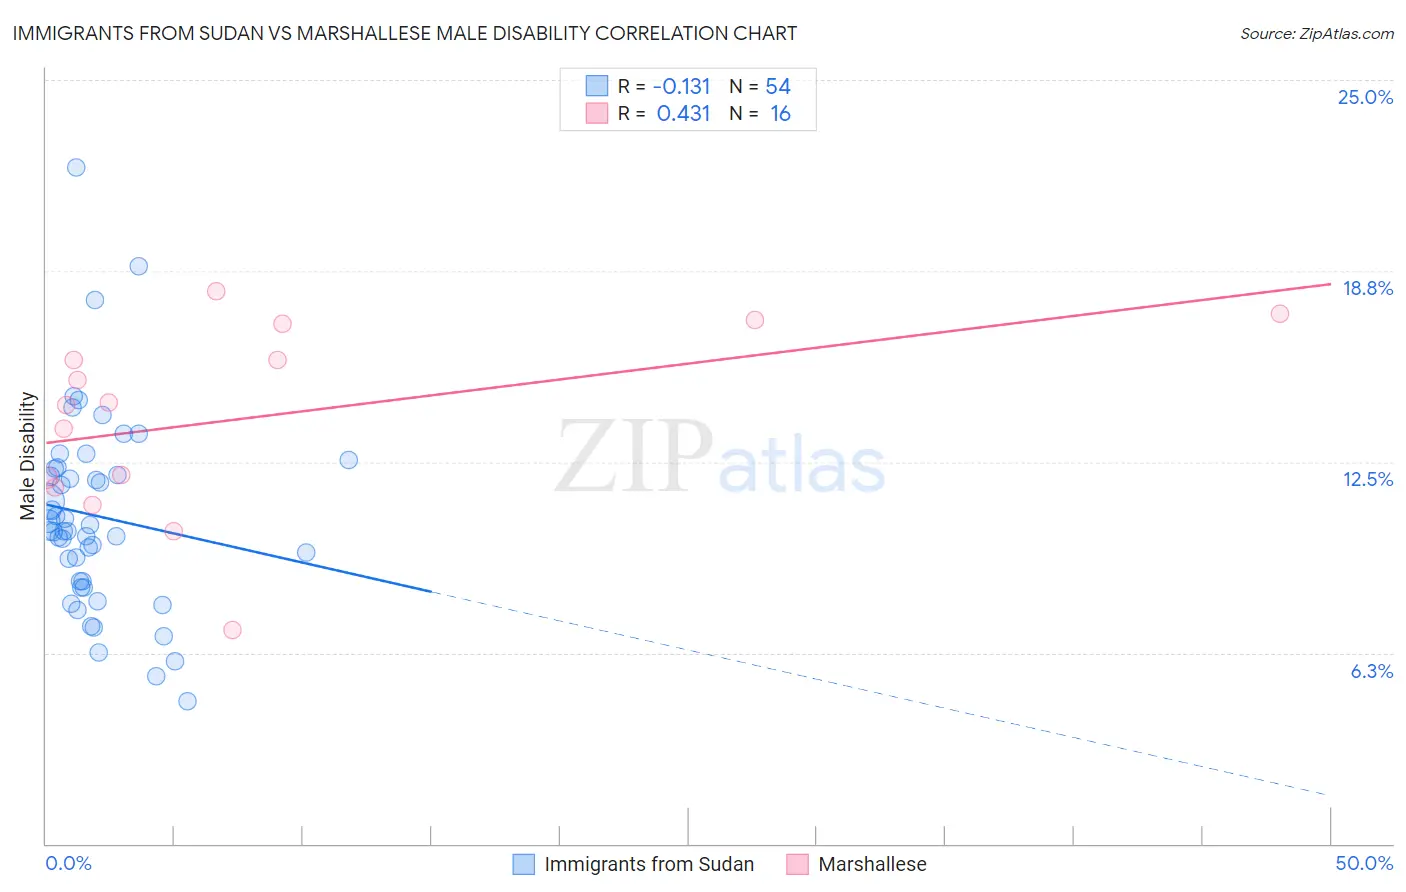
Immigrants from Sudan vs Marshallese Male Disability Correlation Chart
The statistical analysis conducted on geographies consisting of 118,961,882 people shows a poor negative correlation between the proportion of Immigrants from Sudan and percentage of males with a disability in the United States with a correlation coefficient (R) of -0.131 and weighted average of 11.0%. Similarly, the statistical analysis conducted on geographies consisting of 14,761,315 people shows a moderate positive correlation between the proportion of Marshallese and percentage of males with a disability in the United States with a correlation coefficient (R) of 0.431 and weighted average of 12.9%, a difference of 17.6%.
Male Disability Correlation Summary
| Measurement | Immigrants from Sudan | Marshallese |
| Minimum | 4.7% | 7.0% |
| Maximum | 22.1% | 18.1% |
| Range | 17.5% | 11.1% |
| Mean | 10.7% | 13.9% |
| Median | 10.2% | 14.4% |
| Interquartile 25% (IQ1) | 8.6% | 11.8% |
| Interquartile 75% (IQ3) | 12.3% | 16.4% |
| Interquartile Range (IQR) | 3.7% | 4.6% |
| Standard Deviation (Sample) | 3.2% | 3.1% |
| Standard Deviation (Population) | 3.2% | 3.0% |
Similar Demographics by Male Disability
Demographics Similar to Immigrants from Sudan by Male Disability
In terms of male disability, the demographic groups most similar to Immigrants from Sudan are Immigrants from Italy (11.0%, a difference of 0.0%), Arab (11.0%, a difference of 0.0%), South African (11.0%, a difference of 0.020%), Nigerian (11.0%, a difference of 0.040%), and Immigrants from Europe (11.0%, a difference of 0.050%).
| Demographics | Rating | Rank | Male Disability |
| Trinidadians and Tobagonians | 83.3 /100 | #135 | Excellent 11.0% |
| Immigrants | Costa Rica | 82.8 /100 | #136 | Excellent 11.0% |
| Immigrants | Europe | 82.0 /100 | #137 | Excellent 11.0% |
| Nigerians | 81.9 /100 | #138 | Excellent 11.0% |
| South Africans | 81.7 /100 | #139 | Excellent 11.0% |
| Immigrants | Italy | 81.5 /100 | #140 | Excellent 11.0% |
| Arabs | 81.5 /100 | #141 | Excellent 11.0% |
| Immigrants | Sudan | 81.5 /100 | #142 | Excellent 11.0% |
| Moroccans | 80.7 /100 | #143 | Excellent 11.0% |
| Kenyans | 78.1 /100 | #144 | Good 11.0% |
| Costa Ricans | 78.0 /100 | #145 | Good 11.0% |
| Koreans | 77.5 /100 | #146 | Good 11.0% |
| Immigrants | Croatia | 77.3 /100 | #147 | Good 11.0% |
| Sudanese | 77.1 /100 | #148 | Good 11.0% |
| Immigrants | Denmark | 76.4 /100 | #149 | Good 11.0% |
Demographics Similar to Marshallese by Male Disability
In terms of male disability, the demographic groups most similar to Marshallese are Immigrants from Micronesia (12.9%, a difference of 0.10%), Nonimmigrants (12.9%, a difference of 0.16%), Yaqui (12.9%, a difference of 0.24%), Inupiat (13.0%, a difference of 0.27%), and Pennsylvania German (13.0%, a difference of 0.47%).
| Demographics | Rating | Rank | Male Disability |
| Cape Verdeans | 0.0 /100 | #287 | Tragic 12.8% |
| Yup'ik | 0.0 /100 | #288 | Tragic 12.8% |
| Immigrants | Cabo Verde | 0.0 /100 | #289 | Tragic 12.8% |
| Pima | 0.0 /100 | #290 | Tragic 12.8% |
| Whites/Caucasians | 0.0 /100 | #291 | Tragic 12.8% |
| English | 0.0 /100 | #292 | Tragic 12.8% |
| Yaqui | 0.0 /100 | #293 | Tragic 12.9% |
| Marshallese | 0.0 /100 | #294 | Tragic 12.9% |
| Immigrants | Micronesia | 0.0 /100 | #295 | Tragic 12.9% |
| Immigrants | Nonimmigrants | 0.0 /100 | #296 | Tragic 12.9% |
| Inupiat | 0.0 /100 | #297 | Tragic 13.0% |
| Pennsylvania Germans | 0.0 /100 | #298 | Tragic 13.0% |
| Celtics | 0.0 /100 | #299 | Tragic 13.0% |
| Cheyenne | 0.0 /100 | #300 | Tragic 13.0% |
| French | 0.0 /100 | #301 | Tragic 13.0% |