Chippewa vs Marshallese Male Disability
COMPARE
Chippewa
Marshallese
Male Disability
Male Disability Comparison
Chippewa
Marshallese
14.3%
MALE DISABILITY
0.0/ 100
METRIC RATING
328th/ 347
METRIC RANK
12.9%
MALE DISABILITY
0.0/ 100
METRIC RATING
294th/ 347
METRIC RANK
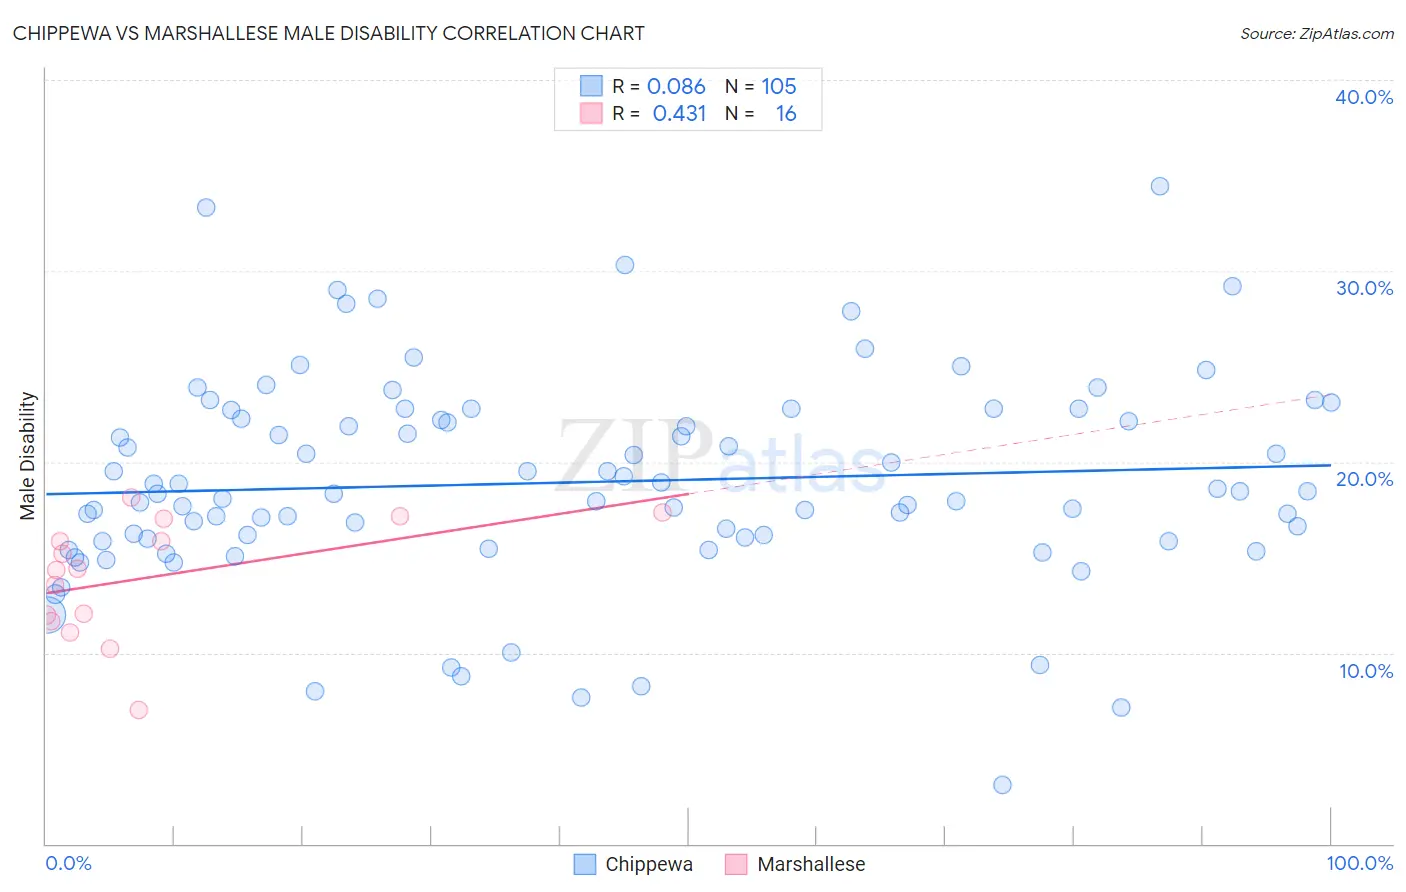
Chippewa vs Marshallese Male Disability Correlation Chart
The statistical analysis conducted on geographies consisting of 215,038,110 people shows a slight positive correlation between the proportion of Chippewa and percentage of males with a disability in the United States with a correlation coefficient (R) of 0.086 and weighted average of 14.3%. Similarly, the statistical analysis conducted on geographies consisting of 14,761,315 people shows a moderate positive correlation between the proportion of Marshallese and percentage of males with a disability in the United States with a correlation coefficient (R) of 0.431 and weighted average of 12.9%, a difference of 10.5%.
Male Disability Correlation Summary
| Measurement | Chippewa | Marshallese |
| Minimum | 3.1% | 7.0% |
| Maximum | 34.5% | 18.1% |
| Range | 31.4% | 11.1% |
| Mean | 18.9% | 13.9% |
| Median | 18.3% | 14.4% |
| Interquartile 25% (IQ1) | 15.9% | 11.8% |
| Interquartile 75% (IQ3) | 22.5% | 16.4% |
| Interquartile Range (IQR) | 6.6% | 4.6% |
| Standard Deviation (Sample) | 5.5% | 3.1% |
| Standard Deviation (Population) | 5.4% | 3.0% |
Similar Demographics by Male Disability
Demographics Similar to Chippewa by Male Disability
In terms of male disability, the demographic groups most similar to Chippewa are Potawatomi (14.2%, a difference of 0.43%), Native/Alaskan (14.2%, a difference of 0.53%), Cajun (14.4%, a difference of 0.57%), Navajo (14.4%, a difference of 0.81%), and Ottawa (14.1%, a difference of 1.5%).
| Demographics | Rating | Rank | Male Disability |
| Shoshone | 0.0 /100 | #321 | Tragic 13.8% |
| Apache | 0.0 /100 | #322 | Tragic 14.0% |
| Osage | 0.0 /100 | #323 | Tragic 14.0% |
| Comanche | 0.0 /100 | #324 | Tragic 14.1% |
| Ottawa | 0.0 /100 | #325 | Tragic 14.1% |
| Natives/Alaskans | 0.0 /100 | #326 | Tragic 14.2% |
| Potawatomi | 0.0 /100 | #327 | Tragic 14.2% |
| Chippewa | 0.0 /100 | #328 | Tragic 14.3% |
| Cajuns | 0.0 /100 | #329 | Tragic 14.4% |
| Navajo | 0.0 /100 | #330 | Tragic 14.4% |
| Tohono O'odham | 0.0 /100 | #331 | Tragic 14.6% |
| Seminole | 0.0 /100 | #332 | Tragic 14.7% |
| Yuman | 0.0 /100 | #333 | Tragic 14.7% |
| Cherokee | 0.0 /100 | #334 | Tragic 14.8% |
| Dutch West Indians | 0.0 /100 | #335 | Tragic 14.8% |
Demographics Similar to Marshallese by Male Disability
In terms of male disability, the demographic groups most similar to Marshallese are Immigrants from Micronesia (12.9%, a difference of 0.10%), Nonimmigrants (12.9%, a difference of 0.16%), Yaqui (12.9%, a difference of 0.24%), Inupiat (13.0%, a difference of 0.27%), and Pennsylvania German (13.0%, a difference of 0.47%).
| Demographics | Rating | Rank | Male Disability |
| Cape Verdeans | 0.0 /100 | #287 | Tragic 12.8% |
| Yup'ik | 0.0 /100 | #288 | Tragic 12.8% |
| Immigrants | Cabo Verde | 0.0 /100 | #289 | Tragic 12.8% |
| Pima | 0.0 /100 | #290 | Tragic 12.8% |
| Whites/Caucasians | 0.0 /100 | #291 | Tragic 12.8% |
| English | 0.0 /100 | #292 | Tragic 12.8% |
| Yaqui | 0.0 /100 | #293 | Tragic 12.9% |
| Marshallese | 0.0 /100 | #294 | Tragic 12.9% |
| Immigrants | Micronesia | 0.0 /100 | #295 | Tragic 12.9% |
| Immigrants | Nonimmigrants | 0.0 /100 | #296 | Tragic 12.9% |
| Inupiat | 0.0 /100 | #297 | Tragic 13.0% |
| Pennsylvania Germans | 0.0 /100 | #298 | Tragic 13.0% |
| Celtics | 0.0 /100 | #299 | Tragic 13.0% |
| Cheyenne | 0.0 /100 | #300 | Tragic 13.0% |
| French | 0.0 /100 | #301 | Tragic 13.0% |