Immigrants from Sweden vs Immigrants from South America Ambulatory Disability
COMPARE
Immigrants from Sweden
Immigrants from South America
Ambulatory Disability
Ambulatory Disability Comparison
Immigrants from Sweden
Immigrants from South America
5.6%
AMBULATORY DISABILITY
99.9/ 100
METRIC RATING
45th/ 347
METRIC RANK
5.8%
AMBULATORY DISABILITY
97.9/ 100
METRIC RATING
101st/ 347
METRIC RANK
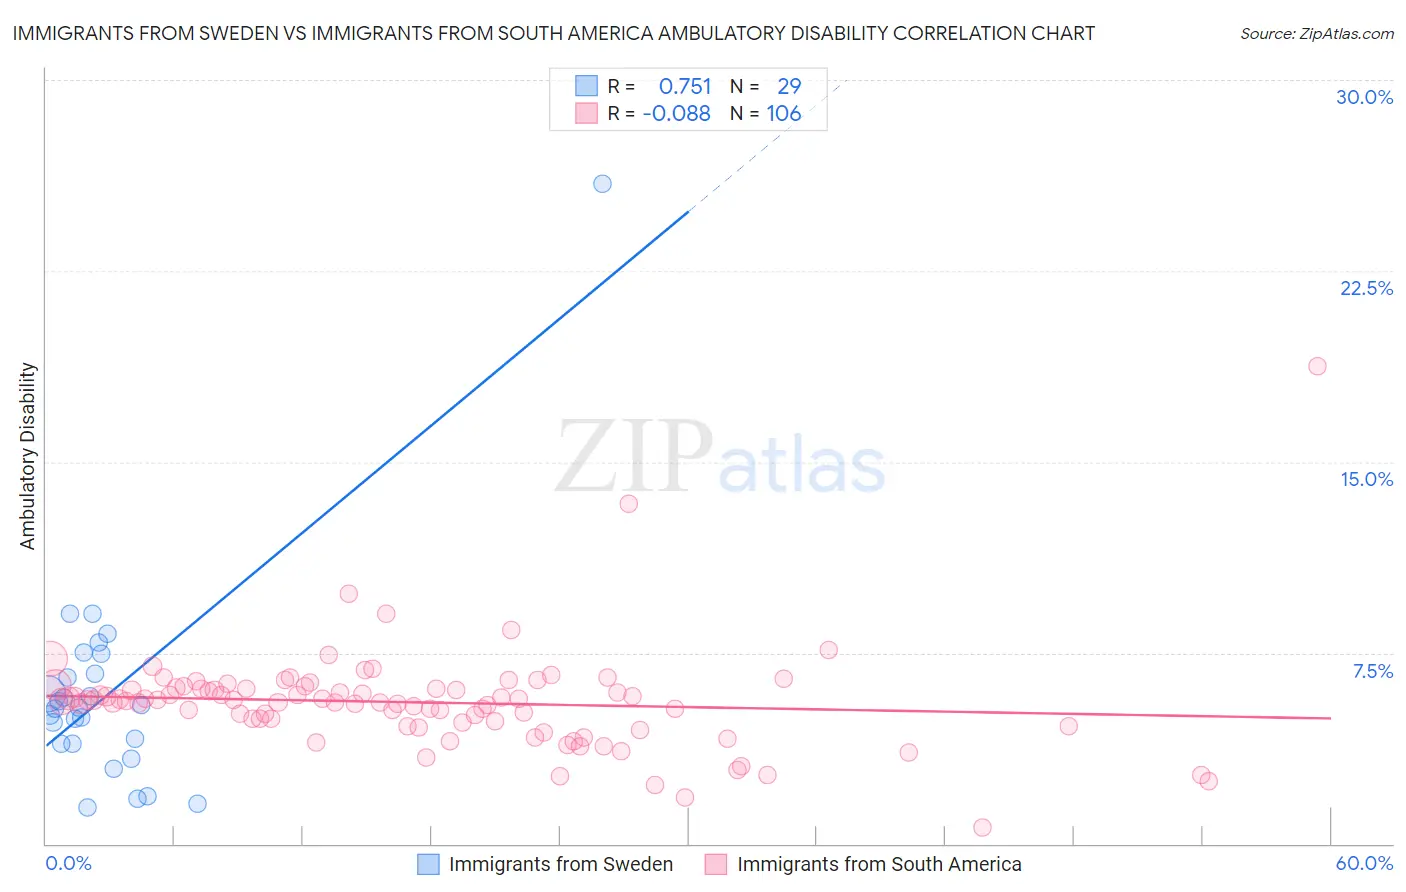
Immigrants from Sweden vs Immigrants from South America Ambulatory Disability Correlation Chart
The statistical analysis conducted on geographies consisting of 164,722,765 people shows a strong positive correlation between the proportion of Immigrants from Sweden and percentage of population with ambulatory disability in the United States with a correlation coefficient (R) of 0.751 and weighted average of 5.6%. Similarly, the statistical analysis conducted on geographies consisting of 486,161,675 people shows a slight negative correlation between the proportion of Immigrants from South America and percentage of population with ambulatory disability in the United States with a correlation coefficient (R) of -0.088 and weighted average of 5.8%, a difference of 4.5%.
Ambulatory Disability Correlation Summary
| Measurement | Immigrants from Sweden | Immigrants from South America |
| Minimum | 1.4% | 0.63% |
| Maximum | 25.9% | 18.8% |
| Range | 24.5% | 18.1% |
| Mean | 5.9% | 5.6% |
| Median | 5.4% | 5.6% |
| Interquartile 25% (IQ1) | 3.9% | 4.7% |
| Interquartile 75% (IQ3) | 7.1% | 6.1% |
| Interquartile Range (IQR) | 3.1% | 1.4% |
| Standard Deviation (Sample) | 4.4% | 2.1% |
| Standard Deviation (Population) | 4.3% | 2.0% |
Similar Demographics by Ambulatory Disability
Demographics Similar to Immigrants from Sweden by Ambulatory Disability
In terms of ambulatory disability, the demographic groups most similar to Immigrants from Sweden are Egyptian (5.6%, a difference of 0.010%), Immigrants from Japan (5.6%, a difference of 0.010%), Immigrants from Argentina (5.6%, a difference of 0.020%), Immigrants from Indonesia (5.5%, a difference of 0.17%), and Bulgarian (5.6%, a difference of 0.22%).
| Demographics | Rating | Rank | Ambulatory Disability |
| Cypriots | 100.0 /100 | #38 | Exceptional 5.5% |
| Immigrants | Eritrea | 100.0 /100 | #39 | Exceptional 5.5% |
| Venezuelans | 99.9 /100 | #40 | Exceptional 5.5% |
| Mongolians | 99.9 /100 | #41 | Exceptional 5.5% |
| Argentineans | 99.9 /100 | #42 | Exceptional 5.5% |
| Paraguayans | 99.9 /100 | #43 | Exceptional 5.5% |
| Immigrants | Indonesia | 99.9 /100 | #44 | Exceptional 5.5% |
| Immigrants | Sweden | 99.9 /100 | #45 | Exceptional 5.6% |
| Egyptians | 99.9 /100 | #46 | Exceptional 5.6% |
| Immigrants | Japan | 99.9 /100 | #47 | Exceptional 5.6% |
| Immigrants | Argentina | 99.9 /100 | #48 | Exceptional 5.6% |
| Bulgarians | 99.9 /100 | #49 | Exceptional 5.6% |
| Luxembourgers | 99.9 /100 | #50 | Exceptional 5.6% |
| Taiwanese | 99.8 /100 | #51 | Exceptional 5.6% |
| Jordanians | 99.8 /100 | #52 | Exceptional 5.6% |
Demographics Similar to Immigrants from South America by Ambulatory Disability
In terms of ambulatory disability, the demographic groups most similar to Immigrants from South America are Immigrants from Serbia (5.8%, a difference of 0.0%), Immigrants from Kenya (5.8%, a difference of 0.080%), Immigrants from Romania (5.8%, a difference of 0.15%), Immigrants from Northern Europe (5.8%, a difference of 0.19%), and New Zealander (5.8%, a difference of 0.21%).
| Demographics | Rating | Rank | Ambulatory Disability |
| Kenyans | 98.4 /100 | #94 | Exceptional 5.8% |
| Immigrants | El Salvador | 98.4 /100 | #95 | Exceptional 5.8% |
| Salvadorans | 98.4 /100 | #96 | Exceptional 5.8% |
| Immigrants | Somalia | 98.3 /100 | #97 | Exceptional 5.8% |
| Immigrants | Lebanon | 98.3 /100 | #98 | Exceptional 5.8% |
| Immigrants | Northern Europe | 98.2 /100 | #99 | Exceptional 5.8% |
| Immigrants | Serbia | 97.9 /100 | #100 | Exceptional 5.8% |
| Immigrants | South America | 97.9 /100 | #101 | Exceptional 5.8% |
| Immigrants | Kenya | 97.8 /100 | #102 | Exceptional 5.8% |
| Immigrants | Romania | 97.7 /100 | #103 | Exceptional 5.8% |
| New Zealanders | 97.6 /100 | #104 | Exceptional 5.8% |
| Immigrants | Czechoslovakia | 97.4 /100 | #105 | Exceptional 5.8% |
| Immigrants | Morocco | 97.3 /100 | #106 | Exceptional 5.8% |
| Uruguayans | 97.2 /100 | #107 | Exceptional 5.8% |
| Colombians | 97.2 /100 | #108 | Exceptional 5.8% |