Lumbee vs Immigrants from South America Ambulatory Disability
COMPARE
Lumbee
Immigrants from South America
Ambulatory Disability
Ambulatory Disability Comparison
Lumbee
Immigrants from South America
9.5%
AMBULATORY DISABILITY
0.0/ 100
METRIC RATING
347th/ 347
METRIC RANK
5.8%
AMBULATORY DISABILITY
97.9/ 100
METRIC RATING
101st/ 347
METRIC RANK
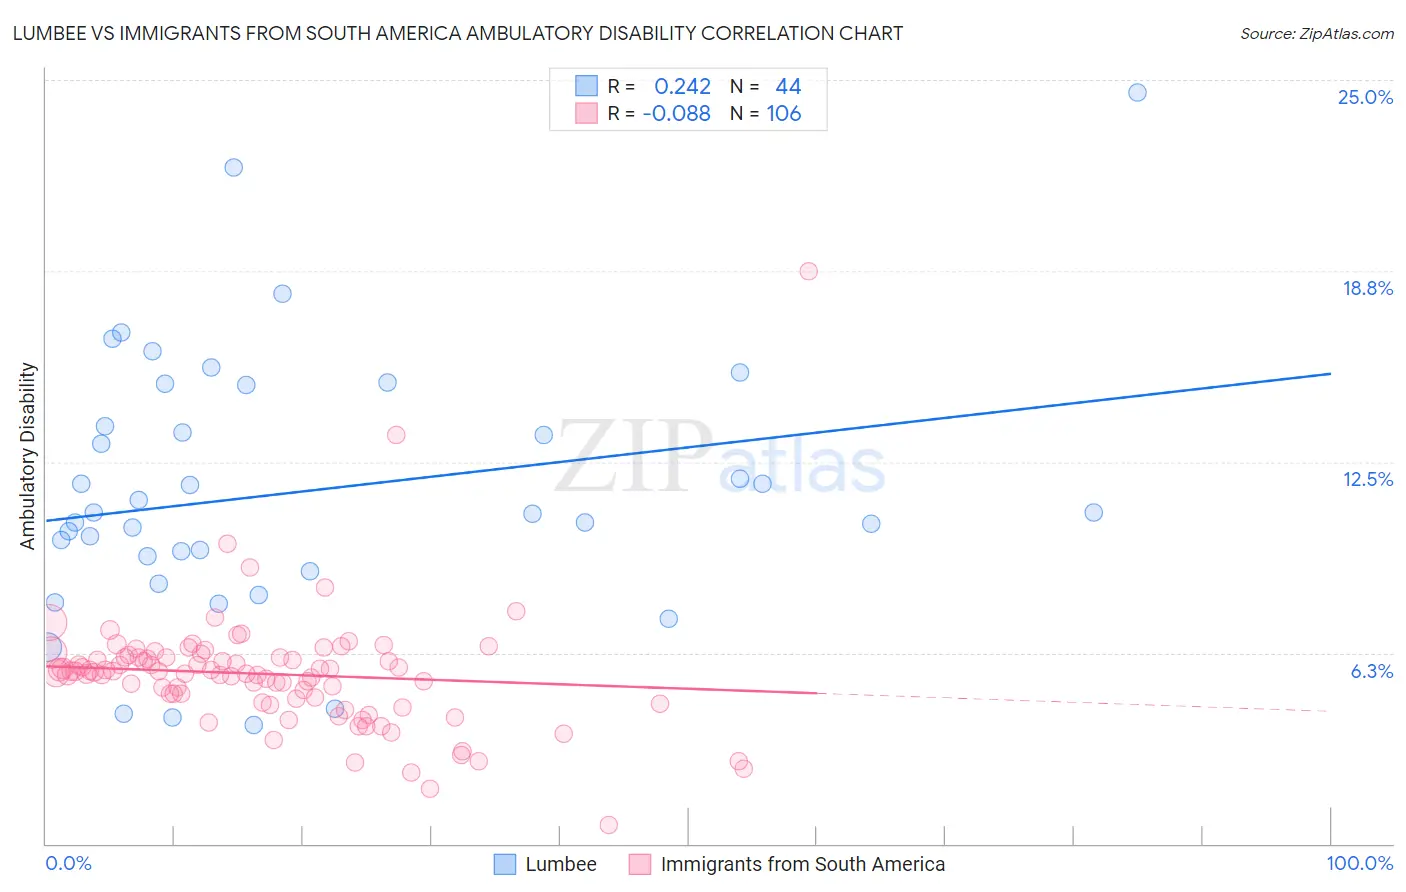
Lumbee vs Immigrants from South America Ambulatory Disability Correlation Chart
The statistical analysis conducted on geographies consisting of 92,273,744 people shows a weak positive correlation between the proportion of Lumbee and percentage of population with ambulatory disability in the United States with a correlation coefficient (R) of 0.242 and weighted average of 9.5%. Similarly, the statistical analysis conducted on geographies consisting of 486,161,675 people shows a slight negative correlation between the proportion of Immigrants from South America and percentage of population with ambulatory disability in the United States with a correlation coefficient (R) of -0.088 and weighted average of 5.8%, a difference of 64.3%.
Ambulatory Disability Correlation Summary
| Measurement | Lumbee | Immigrants from South America |
| Minimum | 3.9% | 0.63% |
| Maximum | 24.6% | 18.8% |
| Range | 20.7% | 18.1% |
| Mean | 11.5% | 5.6% |
| Median | 10.8% | 5.6% |
| Interquartile 25% (IQ1) | 9.2% | 4.7% |
| Interquartile 75% (IQ3) | 14.3% | 6.1% |
| Interquartile Range (IQR) | 5.2% | 1.4% |
| Standard Deviation (Sample) | 4.4% | 2.1% |
| Standard Deviation (Population) | 4.3% | 2.0% |
Similar Demographics by Ambulatory Disability
Demographics Similar to Lumbee by Ambulatory Disability
In terms of ambulatory disability, the demographic groups most similar to Lumbee are Houma (9.3%, a difference of 2.5%), Puerto Rican (8.9%, a difference of 7.5%), Tsimshian (8.8%, a difference of 8.2%), Tohono O'odham (8.7%, a difference of 9.2%), and Kiowa (8.6%, a difference of 10.8%).
| Demographics | Rating | Rank | Ambulatory Disability |
| Cherokee | 0.0 /100 | #333 | Tragic 7.9% |
| Yuman | 0.0 /100 | #334 | Tragic 7.9% |
| Chickasaw | 0.0 /100 | #335 | Tragic 8.0% |
| Seminole | 0.0 /100 | #336 | Tragic 8.0% |
| Dutch West Indians | 0.0 /100 | #337 | Tragic 8.2% |
| Colville | 0.0 /100 | #338 | Tragic 8.2% |
| Pima | 0.0 /100 | #339 | Tragic 8.2% |
| Choctaw | 0.0 /100 | #340 | Tragic 8.3% |
| Creek | 0.0 /100 | #341 | Tragic 8.5% |
| Kiowa | 0.0 /100 | #342 | Tragic 8.6% |
| Tohono O'odham | 0.0 /100 | #343 | Tragic 8.7% |
| Tsimshian | 0.0 /100 | #344 | Tragic 8.8% |
| Puerto Ricans | 0.0 /100 | #345 | Tragic 8.9% |
| Houma | 0.0 /100 | #346 | Tragic 9.3% |
| Lumbee | 0.0 /100 | #347 | Tragic 9.5% |
Demographics Similar to Immigrants from South America by Ambulatory Disability
In terms of ambulatory disability, the demographic groups most similar to Immigrants from South America are Immigrants from Serbia (5.8%, a difference of 0.0%), Immigrants from Kenya (5.8%, a difference of 0.080%), Immigrants from Romania (5.8%, a difference of 0.15%), Immigrants from Northern Europe (5.8%, a difference of 0.19%), and New Zealander (5.8%, a difference of 0.21%).
| Demographics | Rating | Rank | Ambulatory Disability |
| Kenyans | 98.4 /100 | #94 | Exceptional 5.8% |
| Immigrants | El Salvador | 98.4 /100 | #95 | Exceptional 5.8% |
| Salvadorans | 98.4 /100 | #96 | Exceptional 5.8% |
| Immigrants | Somalia | 98.3 /100 | #97 | Exceptional 5.8% |
| Immigrants | Lebanon | 98.3 /100 | #98 | Exceptional 5.8% |
| Immigrants | Northern Europe | 98.2 /100 | #99 | Exceptional 5.8% |
| Immigrants | Serbia | 97.9 /100 | #100 | Exceptional 5.8% |
| Immigrants | South America | 97.9 /100 | #101 | Exceptional 5.8% |
| Immigrants | Kenya | 97.8 /100 | #102 | Exceptional 5.8% |
| Immigrants | Romania | 97.7 /100 | #103 | Exceptional 5.8% |
| New Zealanders | 97.6 /100 | #104 | Exceptional 5.8% |
| Immigrants | Czechoslovakia | 97.4 /100 | #105 | Exceptional 5.8% |
| Immigrants | Morocco | 97.3 /100 | #106 | Exceptional 5.8% |
| Uruguayans | 97.2 /100 | #107 | Exceptional 5.8% |
| Colombians | 97.2 /100 | #108 | Exceptional 5.8% |