Mexican vs Immigrants from Canada Hearing Disability
COMPARE
Mexican
Immigrants from Canada
Hearing Disability
Hearing Disability Comparison
Mexicans
Immigrants from Canada
3.2%
HEARING DISABILITY
5.6/ 100
METRIC RATING
223rd/ 347
METRIC RANK
3.5%
HEARING DISABILITY
0.1/ 100
METRIC RATING
263rd/ 347
METRIC RANK
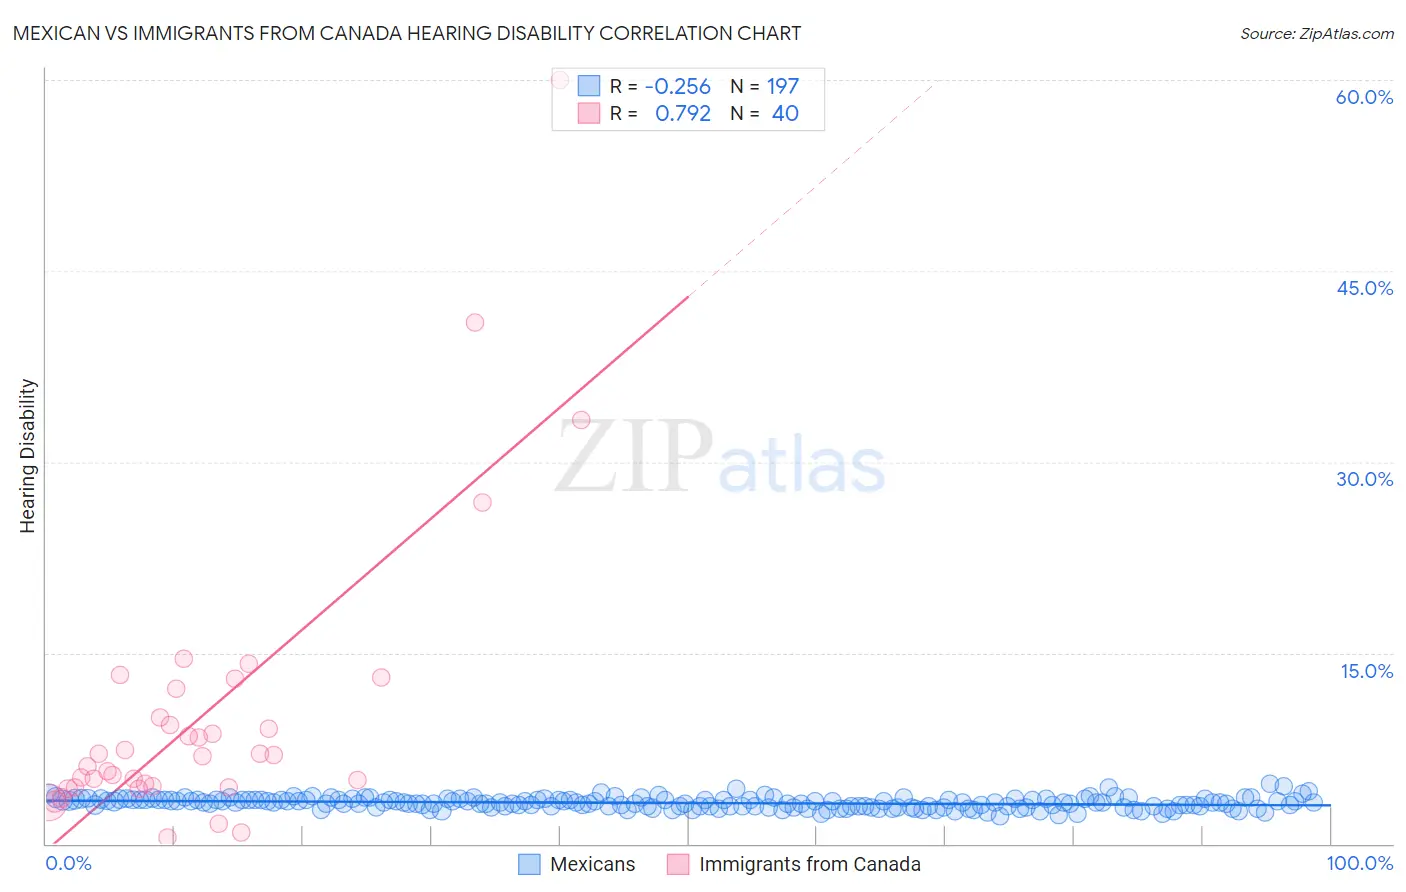
Mexican vs Immigrants from Canada Hearing Disability Correlation Chart
The statistical analysis conducted on geographies consisting of 564,483,125 people shows a weak negative correlation between the proportion of Mexicans and percentage of population with hearing disability in the United States with a correlation coefficient (R) of -0.256 and weighted average of 3.2%. Similarly, the statistical analysis conducted on geographies consisting of 459,215,388 people shows a strong positive correlation between the proportion of Immigrants from Canada and percentage of population with hearing disability in the United States with a correlation coefficient (R) of 0.792 and weighted average of 3.5%, a difference of 8.5%.
Hearing Disability Correlation Summary
| Measurement | Mexican | Immigrants from Canada |
| Minimum | 2.1% | 0.49% |
| Maximum | 4.7% | 60.0% |
| Range | 2.5% | 59.5% |
| Mean | 3.2% | 10.2% |
| Median | 3.2% | 7.0% |
| Interquartile 25% (IQ1) | 2.9% | 4.5% |
| Interquartile 75% (IQ3) | 3.5% | 11.0% |
| Interquartile Range (IQR) | 0.56% | 6.6% |
| Standard Deviation (Sample) | 0.41% | 11.5% |
| Standard Deviation (Population) | 0.41% | 11.3% |
Similar Demographics by Hearing Disability
Demographics Similar to Mexicans by Hearing Disability
In terms of hearing disability, the demographic groups most similar to Mexicans are Icelander (3.2%, a difference of 0.17%), Latvian (3.2%, a difference of 0.21%), Lebanese (3.2%, a difference of 0.25%), Immigrants from Oceania (3.2%, a difference of 0.36%), and Immigrants from Laos (3.2%, a difference of 0.40%).
| Demographics | Rating | Rank | Hearing Disability |
| Immigrants | Norway | 7.3 /100 | #216 | Tragic 3.2% |
| Russians | 7.1 /100 | #217 | Tragic 3.2% |
| Immigrants | Northern Europe | 7.0 /100 | #218 | Tragic 3.2% |
| New Zealanders | 6.8 /100 | #219 | Tragic 3.2% |
| Malaysians | 6.6 /100 | #220 | Tragic 3.2% |
| Immigrants | Laos | 6.6 /100 | #221 | Tragic 3.2% |
| Immigrants | Oceania | 6.5 /100 | #222 | Tragic 3.2% |
| Mexicans | 5.6 /100 | #223 | Tragic 3.2% |
| Icelanders | 5.2 /100 | #224 | Tragic 3.2% |
| Latvians | 5.1 /100 | #225 | Tragic 3.2% |
| Lebanese | 5.0 /100 | #226 | Tragic 3.2% |
| Bhutanese | 4.6 /100 | #227 | Tragic 3.2% |
| Immigrants | Portugal | 4.3 /100 | #228 | Tragic 3.2% |
| Maltese | 4.1 /100 | #229 | Tragic 3.2% |
| Greeks | 3.2 /100 | #230 | Tragic 3.2% |
Demographics Similar to Immigrants from Canada by Hearing Disability
In terms of hearing disability, the demographic groups most similar to Immigrants from Canada are Immigrants from North America (3.5%, a difference of 0.040%), Hawaiian (3.5%, a difference of 0.16%), Portuguese (3.5%, a difference of 0.19%), Immigrants from Germany (3.5%, a difference of 0.22%), and British (3.5%, a difference of 0.24%).
| Demographics | Rating | Rank | Hearing Disability |
| Hmong | 0.2 /100 | #256 | Tragic 3.4% |
| Yaqui | 0.2 /100 | #257 | Tragic 3.4% |
| Northern Europeans | 0.2 /100 | #258 | Tragic 3.4% |
| Slovenes | 0.1 /100 | #259 | Tragic 3.5% |
| Portuguese | 0.1 /100 | #260 | Tragic 3.5% |
| Hawaiians | 0.1 /100 | #261 | Tragic 3.5% |
| Immigrants | North America | 0.1 /100 | #262 | Tragic 3.5% |
| Immigrants | Canada | 0.1 /100 | #263 | Tragic 3.5% |
| Immigrants | Germany | 0.1 /100 | #264 | Tragic 3.5% |
| British | 0.1 /100 | #265 | Tragic 3.5% |
| Belgians | 0.1 /100 | #266 | Tragic 3.5% |
| Canadians | 0.1 /100 | #267 | Tragic 3.5% |
| Spaniards | 0.1 /100 | #268 | Tragic 3.5% |
| Ute | 0.1 /100 | #269 | Tragic 3.5% |
| Europeans | 0.1 /100 | #270 | Tragic 3.5% |