Mexican vs Immigrants from Sudan Hearing Disability
COMPARE
Mexican
Immigrants from Sudan
Hearing Disability
Hearing Disability Comparison
Mexicans
Immigrants from Sudan
3.2%
HEARING DISABILITY
5.6/ 100
METRIC RATING
223rd/ 347
METRIC RANK
2.9%
HEARING DISABILITY
87.8/ 100
METRIC RATING
126th/ 347
METRIC RANK
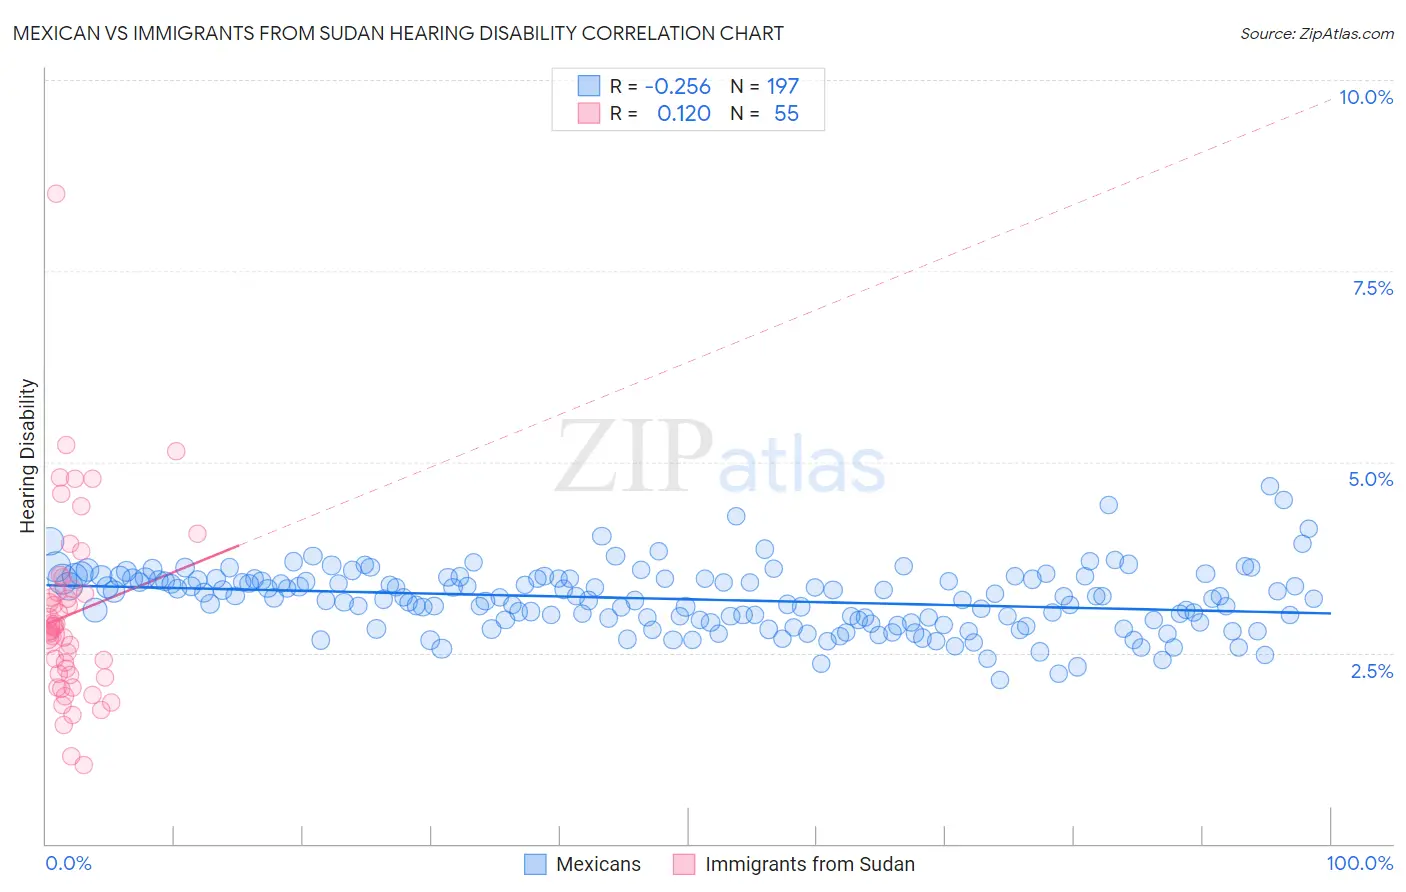
Mexican vs Immigrants from Sudan Hearing Disability Correlation Chart
The statistical analysis conducted on geographies consisting of 564,483,125 people shows a weak negative correlation between the proportion of Mexicans and percentage of population with hearing disability in the United States with a correlation coefficient (R) of -0.256 and weighted average of 3.2%. Similarly, the statistical analysis conducted on geographies consisting of 118,954,451 people shows a poor positive correlation between the proportion of Immigrants from Sudan and percentage of population with hearing disability in the United States with a correlation coefficient (R) of 0.120 and weighted average of 2.9%, a difference of 11.8%.
Hearing Disability Correlation Summary
| Measurement | Mexican | Immigrants from Sudan |
| Minimum | 2.1% | 1.0% |
| Maximum | 4.7% | 8.5% |
| Range | 2.5% | 7.5% |
| Mean | 3.2% | 3.0% |
| Median | 3.2% | 2.8% |
| Interquartile 25% (IQ1) | 2.9% | 2.2% |
| Interquartile 75% (IQ3) | 3.5% | 3.3% |
| Interquartile Range (IQR) | 0.56% | 1.1% |
| Standard Deviation (Sample) | 0.41% | 1.2% |
| Standard Deviation (Population) | 0.41% | 1.2% |
Similar Demographics by Hearing Disability
Demographics Similar to Mexicans by Hearing Disability
In terms of hearing disability, the demographic groups most similar to Mexicans are Icelander (3.2%, a difference of 0.17%), Latvian (3.2%, a difference of 0.21%), Lebanese (3.2%, a difference of 0.25%), Immigrants from Oceania (3.2%, a difference of 0.36%), and Immigrants from Laos (3.2%, a difference of 0.40%).
| Demographics | Rating | Rank | Hearing Disability |
| Immigrants | Norway | 7.3 /100 | #216 | Tragic 3.2% |
| Russians | 7.1 /100 | #217 | Tragic 3.2% |
| Immigrants | Northern Europe | 7.0 /100 | #218 | Tragic 3.2% |
| New Zealanders | 6.8 /100 | #219 | Tragic 3.2% |
| Malaysians | 6.6 /100 | #220 | Tragic 3.2% |
| Immigrants | Laos | 6.6 /100 | #221 | Tragic 3.2% |
| Immigrants | Oceania | 6.5 /100 | #222 | Tragic 3.2% |
| Mexicans | 5.6 /100 | #223 | Tragic 3.2% |
| Icelanders | 5.2 /100 | #224 | Tragic 3.2% |
| Latvians | 5.1 /100 | #225 | Tragic 3.2% |
| Lebanese | 5.0 /100 | #226 | Tragic 3.2% |
| Bhutanese | 4.6 /100 | #227 | Tragic 3.2% |
| Immigrants | Portugal | 4.3 /100 | #228 | Tragic 3.2% |
| Maltese | 4.1 /100 | #229 | Tragic 3.2% |
| Greeks | 3.2 /100 | #230 | Tragic 3.2% |
Demographics Similar to Immigrants from Sudan by Hearing Disability
In terms of hearing disability, the demographic groups most similar to Immigrants from Sudan are Immigrants from Albania (2.9%, a difference of 0.16%), Immigrants from Zaire (2.9%, a difference of 0.19%), Bahamian (2.9%, a difference of 0.19%), South American Indian (2.9%, a difference of 0.22%), and Immigrants from Western Asia (2.9%, a difference of 0.22%).
| Demographics | Rating | Rank | Hearing Disability |
| Kenyans | 89.8 /100 | #119 | Excellent 2.8% |
| Jordanians | 89.5 /100 | #120 | Excellent 2.8% |
| Cubans | 89.4 /100 | #121 | Excellent 2.8% |
| Liberians | 89.0 /100 | #122 | Excellent 2.8% |
| Immigrants | Zaire | 88.6 /100 | #123 | Excellent 2.9% |
| Bahamians | 88.6 /100 | #124 | Excellent 2.9% |
| Immigrants | Albania | 88.5 /100 | #125 | Excellent 2.9% |
| Immigrants | Sudan | 87.8 /100 | #126 | Excellent 2.9% |
| South American Indians | 86.9 /100 | #127 | Excellent 2.9% |
| Immigrants | Western Asia | 86.9 /100 | #128 | Excellent 2.9% |
| Immigrants | Uganda | 86.6 /100 | #129 | Excellent 2.9% |
| Immigrants | Vietnam | 86.5 /100 | #130 | Excellent 2.9% |
| Immigrants | Kenya | 86.1 /100 | #131 | Excellent 2.9% |
| Chileans | 85.8 /100 | #132 | Excellent 2.9% |
| Immigrants | Syria | 85.8 /100 | #133 | Excellent 2.9% |