Mexican vs Shoshone Hearing Disability
COMPARE
Mexican
Shoshone
Hearing Disability
Hearing Disability Comparison
Mexicans
Shoshone
3.2%
HEARING DISABILITY
5.6/ 100
METRIC RATING
223rd/ 347
METRIC RANK
4.0%
HEARING DISABILITY
0.0/ 100
METRIC RATING
320th/ 347
METRIC RANK
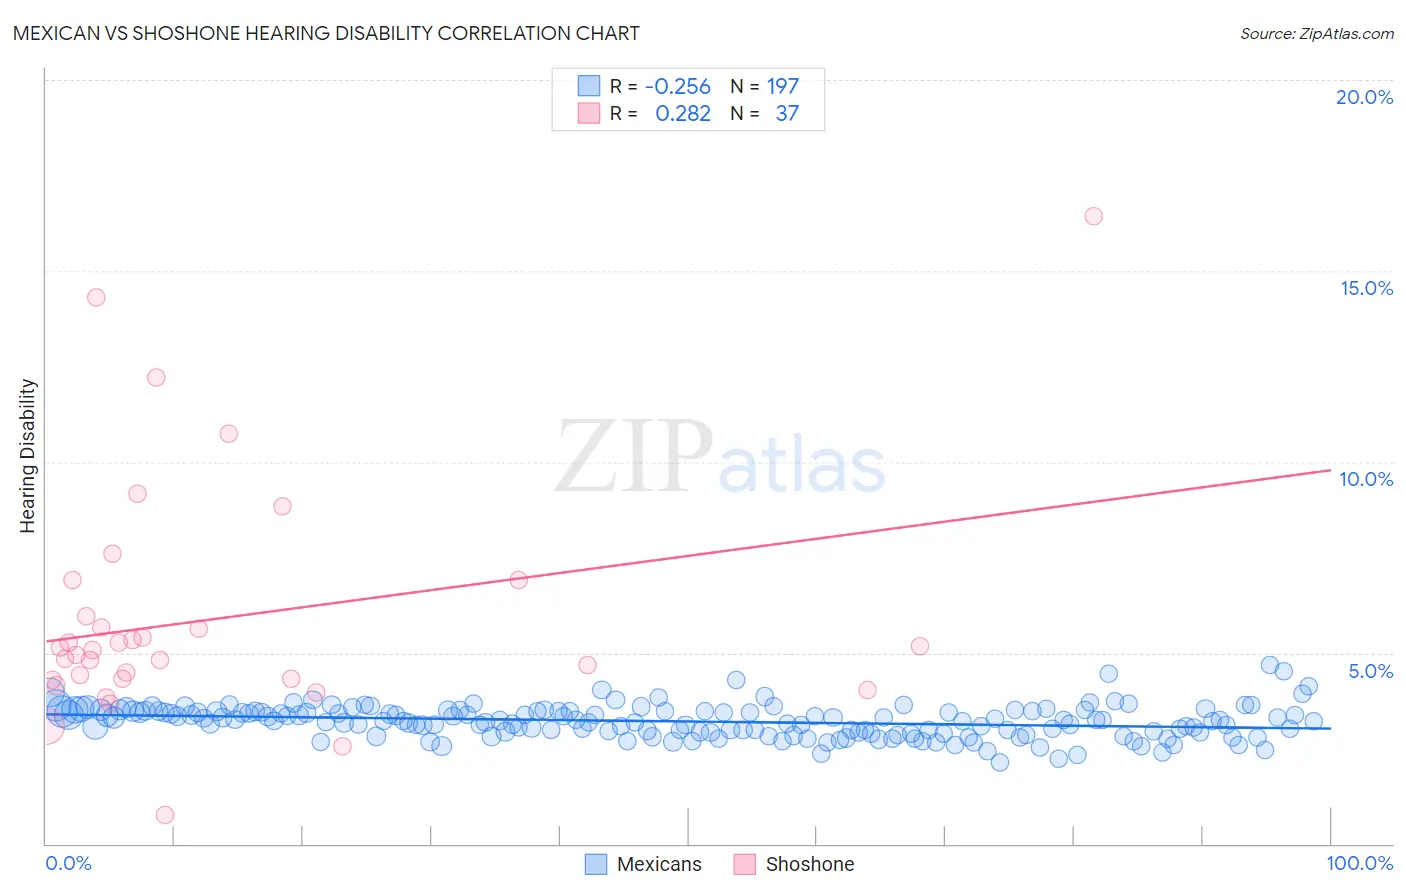
Mexican vs Shoshone Hearing Disability Correlation Chart
The statistical analysis conducted on geographies consisting of 564,483,125 people shows a weak negative correlation between the proportion of Mexicans and percentage of population with hearing disability in the United States with a correlation coefficient (R) of -0.256 and weighted average of 3.2%. Similarly, the statistical analysis conducted on geographies consisting of 66,619,523 people shows a weak positive correlation between the proportion of Shoshone and percentage of population with hearing disability in the United States with a correlation coefficient (R) of 0.282 and weighted average of 4.0%, a difference of 26.1%.
Hearing Disability Correlation Summary
| Measurement | Mexican | Shoshone |
| Minimum | 2.1% | 0.77% |
| Maximum | 4.7% | 16.4% |
| Range | 2.5% | 15.7% |
| Mean | 3.2% | 5.9% |
| Median | 3.2% | 5.1% |
| Interquartile 25% (IQ1) | 2.9% | 4.3% |
| Interquartile 75% (IQ3) | 3.5% | 6.4% |
| Interquartile Range (IQR) | 0.56% | 2.1% |
| Standard Deviation (Sample) | 0.41% | 3.1% |
| Standard Deviation (Population) | 0.41% | 3.1% |
Similar Demographics by Hearing Disability
Demographics Similar to Mexicans by Hearing Disability
In terms of hearing disability, the demographic groups most similar to Mexicans are Icelander (3.2%, a difference of 0.17%), Latvian (3.2%, a difference of 0.21%), Lebanese (3.2%, a difference of 0.25%), Immigrants from Oceania (3.2%, a difference of 0.36%), and Immigrants from Laos (3.2%, a difference of 0.40%).
| Demographics | Rating | Rank | Hearing Disability |
| Immigrants | Norway | 7.3 /100 | #216 | Tragic 3.2% |
| Russians | 7.1 /100 | #217 | Tragic 3.2% |
| Immigrants | Northern Europe | 7.0 /100 | #218 | Tragic 3.2% |
| New Zealanders | 6.8 /100 | #219 | Tragic 3.2% |
| Malaysians | 6.6 /100 | #220 | Tragic 3.2% |
| Immigrants | Laos | 6.6 /100 | #221 | Tragic 3.2% |
| Immigrants | Oceania | 6.5 /100 | #222 | Tragic 3.2% |
| Mexicans | 5.6 /100 | #223 | Tragic 3.2% |
| Icelanders | 5.2 /100 | #224 | Tragic 3.2% |
| Latvians | 5.1 /100 | #225 | Tragic 3.2% |
| Lebanese | 5.0 /100 | #226 | Tragic 3.2% |
| Bhutanese | 4.6 /100 | #227 | Tragic 3.2% |
| Immigrants | Portugal | 4.3 /100 | #228 | Tragic 3.2% |
| Maltese | 4.1 /100 | #229 | Tragic 3.2% |
| Greeks | 3.2 /100 | #230 | Tragic 3.2% |
Demographics Similar to Shoshone by Hearing Disability
In terms of hearing disability, the demographic groups most similar to Shoshone are Chippewa (4.0%, a difference of 0.81%), Paiute (4.1%, a difference of 1.2%), Cheyenne (4.0%, a difference of 1.5%), Seminole (4.1%, a difference of 1.5%), and Comanche (4.0%, a difference of 1.6%).
| Demographics | Rating | Rank | Hearing Disability |
| Hopi | 0.0 /100 | #313 | Tragic 3.9% |
| Yakama | 0.0 /100 | #314 | Tragic 3.9% |
| Puget Sound Salish | 0.0 /100 | #315 | Tragic 3.9% |
| Spanish Americans | 0.0 /100 | #316 | Tragic 4.0% |
| Comanche | 0.0 /100 | #317 | Tragic 4.0% |
| Cheyenne | 0.0 /100 | #318 | Tragic 4.0% |
| Chippewa | 0.0 /100 | #319 | Tragic 4.0% |
| Shoshone | 0.0 /100 | #320 | Tragic 4.0% |
| Paiute | 0.0 /100 | #321 | Tragic 4.1% |
| Seminole | 0.0 /100 | #322 | Tragic 4.1% |
| Apache | 0.0 /100 | #323 | Tragic 4.1% |
| Osage | 0.0 /100 | #324 | Tragic 4.1% |
| Lumbee | 0.0 /100 | #325 | Tragic 4.1% |
| Potawatomi | 0.0 /100 | #326 | Tragic 4.1% |
| Arapaho | 0.0 /100 | #327 | Tragic 4.1% |