Mexican vs Immigrants from Caribbean Cognitive Disability
COMPARE
Mexican
Immigrants from Caribbean
Cognitive Disability
Cognitive Disability Comparison
Mexicans
Immigrants from Caribbean
17.8%
COGNITIVE DISABILITY
1.1/ 100
METRIC RATING
241st/ 347
METRIC RANK
17.5%
COGNITIVE DISABILITY
11.0/ 100
METRIC RATING
203rd/ 347
METRIC RANK
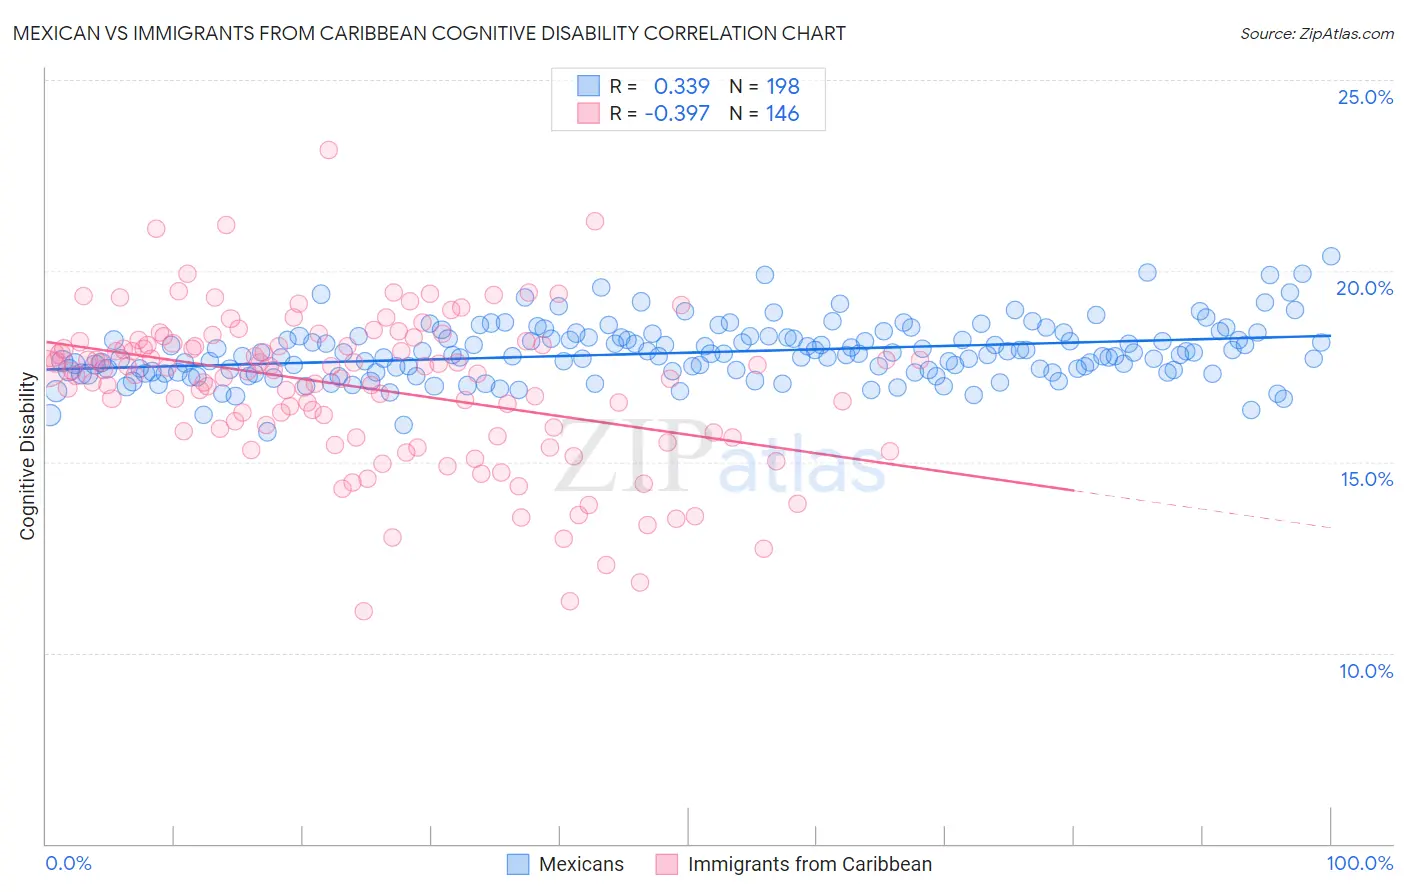
Mexican vs Immigrants from Caribbean Cognitive Disability Correlation Chart
The statistical analysis conducted on geographies consisting of 565,048,688 people shows a mild positive correlation between the proportion of Mexicans and percentage of population with cognitive disability in the United States with a correlation coefficient (R) of 0.339 and weighted average of 17.8%. Similarly, the statistical analysis conducted on geographies consisting of 449,949,141 people shows a mild negative correlation between the proportion of Immigrants from Caribbean and percentage of population with cognitive disability in the United States with a correlation coefficient (R) of -0.397 and weighted average of 17.5%, a difference of 1.7%.
Cognitive Disability Correlation Summary
| Measurement | Mexican | Immigrants from Caribbean |
| Minimum | 15.8% | 11.1% |
| Maximum | 20.4% | 23.2% |
| Range | 4.6% | 12.1% |
| Mean | 17.9% | 16.9% |
| Median | 17.8% | 17.4% |
| Interquartile 25% (IQ1) | 17.3% | 15.8% |
| Interquartile 75% (IQ3) | 18.2% | 18.1% |
| Interquartile Range (IQR) | 0.90% | 2.3% |
| Standard Deviation (Sample) | 0.75% | 2.0% |
| Standard Deviation (Population) | 0.75% | 2.0% |
Similar Demographics by Cognitive Disability
Demographics Similar to Mexicans by Cognitive Disability
In terms of cognitive disability, the demographic groups most similar to Mexicans are Paiute (17.8%, a difference of 0.020%), Immigrants from Bangladesh (17.8%, a difference of 0.090%), Jamaican (17.9%, a difference of 0.13%), Iraqi (17.8%, a difference of 0.14%), and Cajun (17.8%, a difference of 0.18%).
| Demographics | Rating | Rank | Cognitive Disability |
| Osage | 2.0 /100 | #234 | Tragic 17.8% |
| Spanish American Indians | 2.0 /100 | #235 | Tragic 17.8% |
| Immigrants | Iraq | 1.8 /100 | #236 | Tragic 17.8% |
| Immigrants | Mexico | 1.8 /100 | #237 | Tragic 17.8% |
| Cheyenne | 1.7 /100 | #238 | Tragic 17.8% |
| Cajuns | 1.4 /100 | #239 | Tragic 17.8% |
| Iraqis | 1.4 /100 | #240 | Tragic 17.8% |
| Mexicans | 1.1 /100 | #241 | Tragic 17.8% |
| Paiute | 1.1 /100 | #242 | Tragic 17.8% |
| Immigrants | Bangladesh | 1.0 /100 | #243 | Tragic 17.8% |
| Jamaicans | 0.9 /100 | #244 | Tragic 17.9% |
| Trinidadians and Tobagonians | 0.8 /100 | #245 | Tragic 17.9% |
| Immigrants | Thailand | 0.8 /100 | #246 | Tragic 17.9% |
| Samoans | 0.7 /100 | #247 | Tragic 17.9% |
| French American Indians | 0.7 /100 | #248 | Tragic 17.9% |
Demographics Similar to Immigrants from Caribbean by Cognitive Disability
In terms of cognitive disability, the demographic groups most similar to Immigrants from Caribbean are Immigrants from Zimbabwe (17.5%, a difference of 0.0%), Puget Sound Salish (17.5%, a difference of 0.010%), Alaska Native (17.5%, a difference of 0.050%), Immigrants from Morocco (17.5%, a difference of 0.070%), and Immigrants from Latin America (17.6%, a difference of 0.10%).
| Demographics | Rating | Rank | Cognitive Disability |
| Guyanese | 17.5 /100 | #196 | Poor 17.5% |
| Immigrants | Afghanistan | 16.7 /100 | #197 | Poor 17.5% |
| Immigrants | Panama | 14.8 /100 | #198 | Poor 17.5% |
| Immigrants | Singapore | 14.3 /100 | #199 | Poor 17.5% |
| Haitians | 14.1 /100 | #200 | Poor 17.5% |
| South American Indians | 13.0 /100 | #201 | Poor 17.5% |
| Immigrants | Morocco | 12.0 /100 | #202 | Poor 17.5% |
| Immigrants | Caribbean | 11.0 /100 | #203 | Poor 17.5% |
| Immigrants | Zimbabwe | 11.0 /100 | #204 | Poor 17.5% |
| Puget Sound Salish | 10.9 /100 | #205 | Poor 17.5% |
| Alaska Natives | 10.4 /100 | #206 | Poor 17.5% |
| Immigrants | Latin America | 9.7 /100 | #207 | Tragic 17.6% |
| Immigrants | Cameroon | 9.3 /100 | #208 | Tragic 17.6% |
| Immigrants | Trinidad and Tobago | 8.7 /100 | #209 | Tragic 17.6% |
| Immigrants | Jamaica | 8.5 /100 | #210 | Tragic 17.6% |