Mexican vs Dutch West Indian Cognitive Disability
COMPARE
Mexican
Dutch West Indian
Cognitive Disability
Cognitive Disability Comparison
Mexicans
Dutch West Indians
17.8%
COGNITIVE DISABILITY
1.1/ 100
METRIC RATING
241st/ 347
METRIC RANK
18.1%
COGNITIVE DISABILITY
0.1/ 100
METRIC RATING
287th/ 347
METRIC RANK
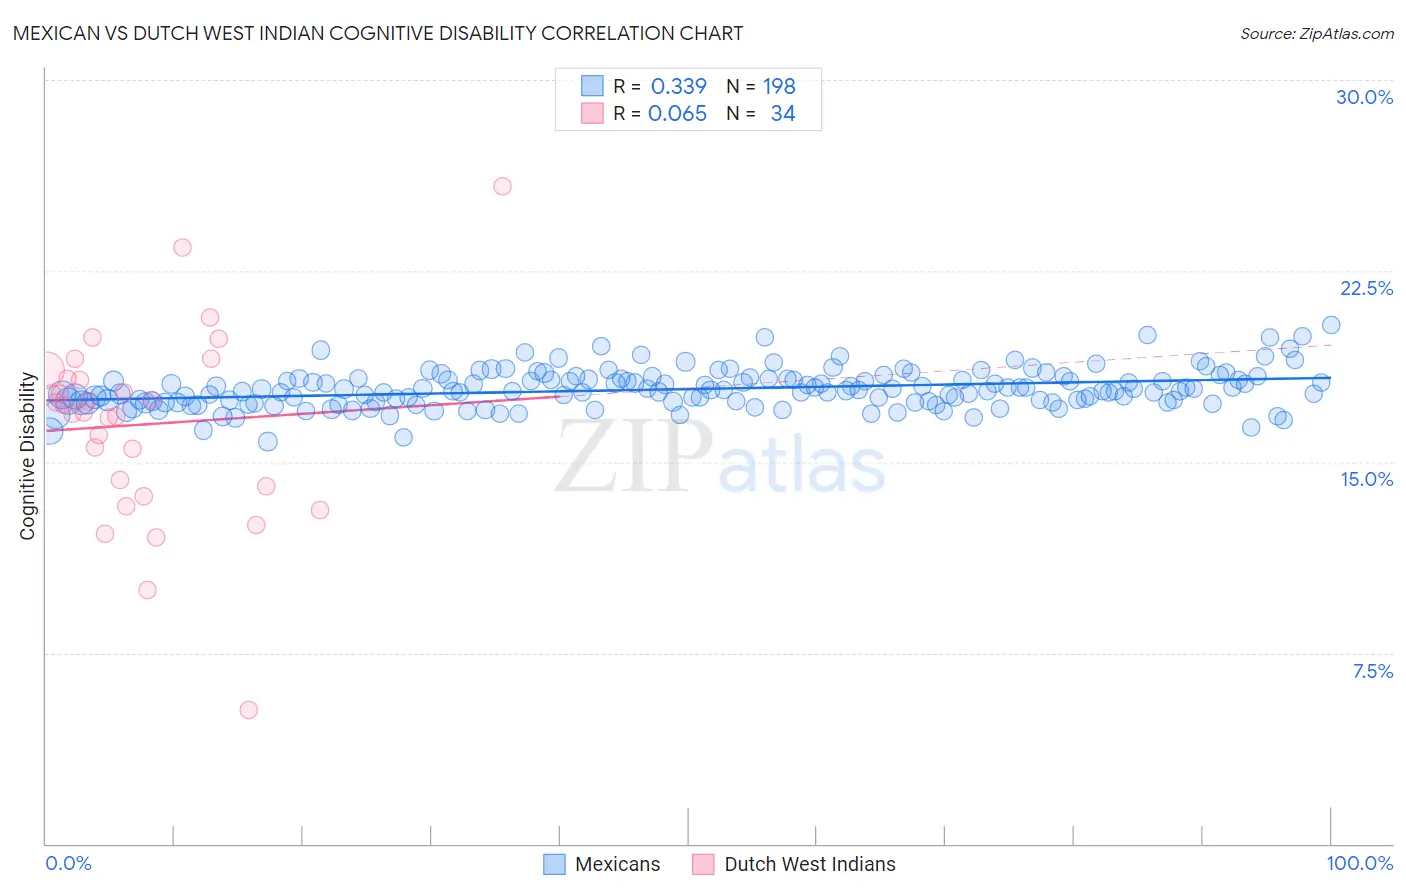
Mexican vs Dutch West Indian Cognitive Disability Correlation Chart
The statistical analysis conducted on geographies consisting of 565,048,688 people shows a mild positive correlation between the proportion of Mexicans and percentage of population with cognitive disability in the United States with a correlation coefficient (R) of 0.339 and weighted average of 17.8%. Similarly, the statistical analysis conducted on geographies consisting of 85,769,565 people shows a slight positive correlation between the proportion of Dutch West Indians and percentage of population with cognitive disability in the United States with a correlation coefficient (R) of 0.065 and weighted average of 18.1%, a difference of 1.7%.
Cognitive Disability Correlation Summary
| Measurement | Mexican | Dutch West Indian |
| Minimum | 15.8% | 5.3% |
| Maximum | 20.4% | 25.8% |
| Range | 4.6% | 20.5% |
| Mean | 17.9% | 16.5% |
| Median | 17.8% | 17.1% |
| Interquartile 25% (IQ1) | 17.3% | 14.0% |
| Interquartile 75% (IQ3) | 18.2% | 18.3% |
| Interquartile Range (IQR) | 0.90% | 4.2% |
| Standard Deviation (Sample) | 0.75% | 3.8% |
| Standard Deviation (Population) | 0.75% | 3.7% |
Similar Demographics by Cognitive Disability
Demographics Similar to Mexicans by Cognitive Disability
In terms of cognitive disability, the demographic groups most similar to Mexicans are Paiute (17.8%, a difference of 0.020%), Immigrants from Bangladesh (17.8%, a difference of 0.090%), Jamaican (17.9%, a difference of 0.13%), Iraqi (17.8%, a difference of 0.14%), and Cajun (17.8%, a difference of 0.18%).
| Demographics | Rating | Rank | Cognitive Disability |
| Osage | 2.0 /100 | #234 | Tragic 17.8% |
| Spanish American Indians | 2.0 /100 | #235 | Tragic 17.8% |
| Immigrants | Iraq | 1.8 /100 | #236 | Tragic 17.8% |
| Immigrants | Mexico | 1.8 /100 | #237 | Tragic 17.8% |
| Cheyenne | 1.7 /100 | #238 | Tragic 17.8% |
| Cajuns | 1.4 /100 | #239 | Tragic 17.8% |
| Iraqis | 1.4 /100 | #240 | Tragic 17.8% |
| Mexicans | 1.1 /100 | #241 | Tragic 17.8% |
| Paiute | 1.1 /100 | #242 | Tragic 17.8% |
| Immigrants | Bangladesh | 1.0 /100 | #243 | Tragic 17.8% |
| Jamaicans | 0.9 /100 | #244 | Tragic 17.9% |
| Trinidadians and Tobagonians | 0.8 /100 | #245 | Tragic 17.9% |
| Immigrants | Thailand | 0.8 /100 | #246 | Tragic 17.9% |
| Samoans | 0.7 /100 | #247 | Tragic 17.9% |
| French American Indians | 0.7 /100 | #248 | Tragic 17.9% |
Demographics Similar to Dutch West Indians by Cognitive Disability
In terms of cognitive disability, the demographic groups most similar to Dutch West Indians are Immigrants from West Indies (18.1%, a difference of 0.010%), Native/Alaskan (18.1%, a difference of 0.020%), Kenyan (18.1%, a difference of 0.040%), Immigrants from Africa (18.1%, a difference of 0.050%), and Bermudan (18.1%, a difference of 0.080%).
| Demographics | Rating | Rank | Cognitive Disability |
| West Indians | 0.1 /100 | #280 | Tragic 18.1% |
| Yakama | 0.1 /100 | #281 | Tragic 18.1% |
| Immigrants | Cambodia | 0.1 /100 | #282 | Tragic 18.1% |
| Nigerians | 0.1 /100 | #283 | Tragic 18.1% |
| Immigrants | Uganda | 0.1 /100 | #284 | Tragic 18.1% |
| Bermudans | 0.1 /100 | #285 | Tragic 18.1% |
| Kenyans | 0.1 /100 | #286 | Tragic 18.1% |
| Dutch West Indians | 0.1 /100 | #287 | Tragic 18.1% |
| Immigrants | West Indies | 0.1 /100 | #288 | Tragic 18.1% |
| Natives/Alaskans | 0.1 /100 | #289 | Tragic 18.1% |
| Immigrants | Africa | 0.1 /100 | #290 | Tragic 18.1% |
| Ottawa | 0.1 /100 | #291 | Tragic 18.2% |
| Iroquois | 0.1 /100 | #292 | Tragic 18.2% |
| Central American Indians | 0.1 /100 | #293 | Tragic 18.2% |
| British West Indians | 0.1 /100 | #294 | Tragic 18.2% |