Mexican vs Immigrants from Japan Cognitive Disability
COMPARE
Mexican
Immigrants from Japan
Cognitive Disability
Cognitive Disability Comparison
Mexicans
Immigrants from Japan
17.8%
COGNITIVE DISABILITY
1.1/ 100
METRIC RATING
241st/ 347
METRIC RANK
16.9%
COGNITIVE DISABILITY
96.2/ 100
METRIC RATING
117th/ 347
METRIC RANK
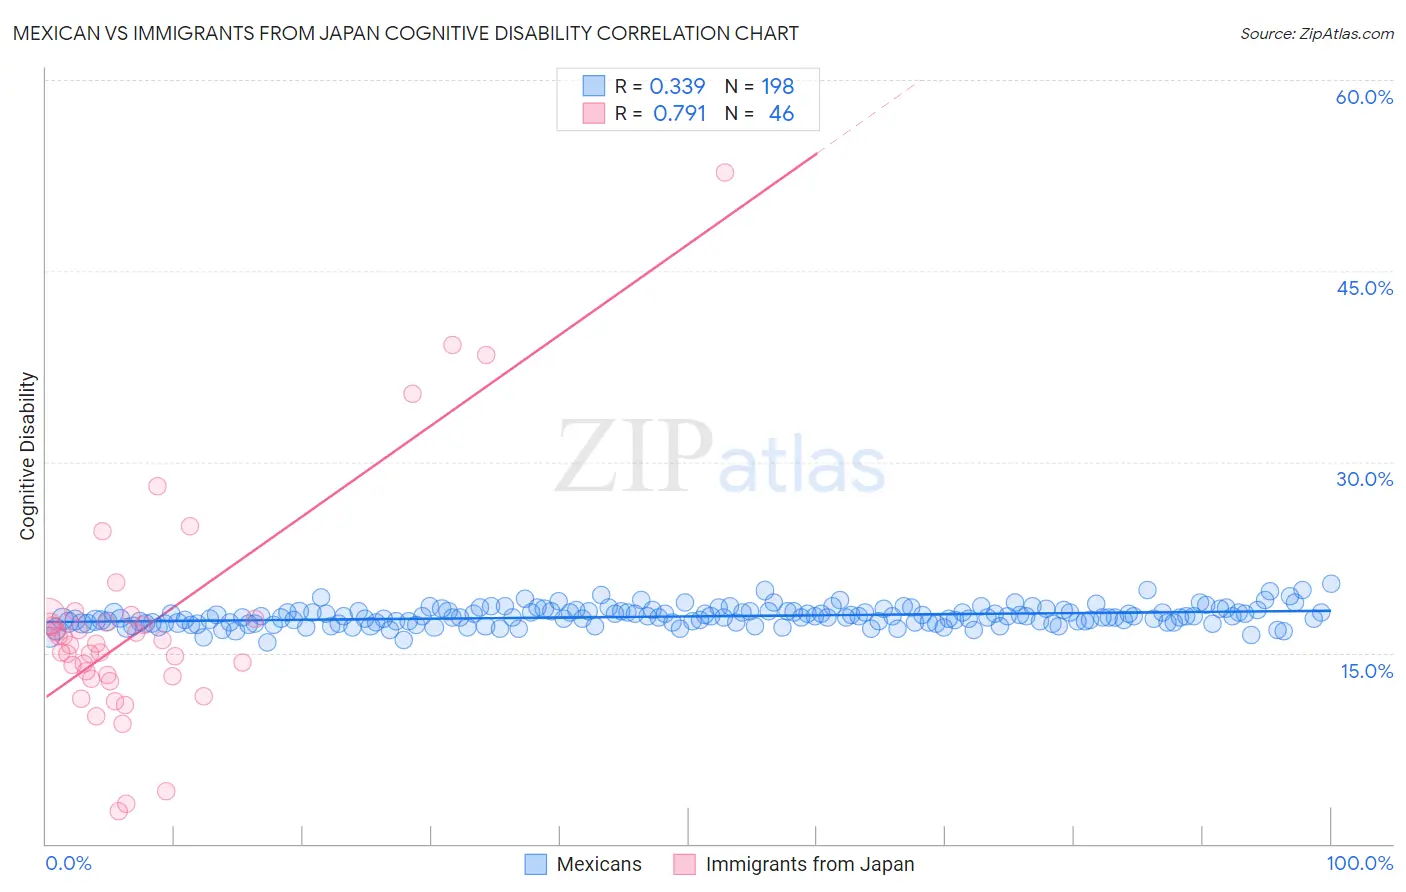
Mexican vs Immigrants from Japan Cognitive Disability Correlation Chart
The statistical analysis conducted on geographies consisting of 565,048,688 people shows a mild positive correlation between the proportion of Mexicans and percentage of population with cognitive disability in the United States with a correlation coefficient (R) of 0.339 and weighted average of 17.8%. Similarly, the statistical analysis conducted on geographies consisting of 340,148,832 people shows a strong positive correlation between the proportion of Immigrants from Japan and percentage of population with cognitive disability in the United States with a correlation coefficient (R) of 0.791 and weighted average of 16.9%, a difference of 5.6%.
Cognitive Disability Correlation Summary
| Measurement | Mexican | Immigrants from Japan |
| Minimum | 15.8% | 2.6% |
| Maximum | 20.4% | 52.8% |
| Range | 4.6% | 50.2% |
| Mean | 17.9% | 17.2% |
| Median | 17.8% | 15.7% |
| Interquartile 25% (IQ1) | 17.3% | 13.1% |
| Interquartile 75% (IQ3) | 18.2% | 17.7% |
| Interquartile Range (IQR) | 0.90% | 4.6% |
| Standard Deviation (Sample) | 0.75% | 9.1% |
| Standard Deviation (Population) | 0.75% | 9.0% |
Similar Demographics by Cognitive Disability
Demographics Similar to Mexicans by Cognitive Disability
In terms of cognitive disability, the demographic groups most similar to Mexicans are Paiute (17.8%, a difference of 0.020%), Immigrants from Bangladesh (17.8%, a difference of 0.090%), Jamaican (17.9%, a difference of 0.13%), Iraqi (17.8%, a difference of 0.14%), and Cajun (17.8%, a difference of 0.18%).
| Demographics | Rating | Rank | Cognitive Disability |
| Osage | 2.0 /100 | #234 | Tragic 17.8% |
| Spanish American Indians | 2.0 /100 | #235 | Tragic 17.8% |
| Immigrants | Iraq | 1.8 /100 | #236 | Tragic 17.8% |
| Immigrants | Mexico | 1.8 /100 | #237 | Tragic 17.8% |
| Cheyenne | 1.7 /100 | #238 | Tragic 17.8% |
| Cajuns | 1.4 /100 | #239 | Tragic 17.8% |
| Iraqis | 1.4 /100 | #240 | Tragic 17.8% |
| Mexicans | 1.1 /100 | #241 | Tragic 17.8% |
| Paiute | 1.1 /100 | #242 | Tragic 17.8% |
| Immigrants | Bangladesh | 1.0 /100 | #243 | Tragic 17.8% |
| Jamaicans | 0.9 /100 | #244 | Tragic 17.9% |
| Trinidadians and Tobagonians | 0.8 /100 | #245 | Tragic 17.9% |
| Immigrants | Thailand | 0.8 /100 | #246 | Tragic 17.9% |
| Samoans | 0.7 /100 | #247 | Tragic 17.9% |
| French American Indians | 0.7 /100 | #248 | Tragic 17.9% |
Demographics Similar to Immigrants from Japan by Cognitive Disability
In terms of cognitive disability, the demographic groups most similar to Immigrants from Japan are Immigrants from Denmark (16.9%, a difference of 0.010%), Inupiat (16.9%, a difference of 0.050%), South African (16.9%, a difference of 0.13%), Yup'ik (16.9%, a difference of 0.15%), and Korean (16.8%, a difference of 0.20%).
| Demographics | Rating | Rank | Cognitive Disability |
| Arapaho | 97.3 /100 | #110 | Exceptional 16.8% |
| Uruguayans | 97.2 /100 | #111 | Exceptional 16.8% |
| Indians (Asian) | 97.2 /100 | #112 | Exceptional 16.8% |
| Immigrants | Sri Lanka | 97.1 /100 | #113 | Exceptional 16.8% |
| Koreans | 97.1 /100 | #114 | Exceptional 16.8% |
| Yup'ik | 96.9 /100 | #115 | Exceptional 16.9% |
| Inupiat | 96.5 /100 | #116 | Exceptional 16.9% |
| Immigrants | Japan | 96.2 /100 | #117 | Exceptional 16.9% |
| Immigrants | Denmark | 96.2 /100 | #118 | Exceptional 16.9% |
| South Africans | 95.5 /100 | #119 | Exceptional 16.9% |
| Scottish | 95.0 /100 | #120 | Exceptional 16.9% |
| Immigrants | China | 94.9 /100 | #121 | Exceptional 16.9% |
| Immigrants | Western Europe | 94.8 /100 | #122 | Exceptional 16.9% |
| Portuguese | 94.7 /100 | #123 | Exceptional 16.9% |
| Turks | 94.5 /100 | #124 | Exceptional 16.9% |