Mexican vs Immigrants from Honduras Cognitive Disability
COMPARE
Mexican
Immigrants from Honduras
Cognitive Disability
Cognitive Disability Comparison
Mexicans
Immigrants from Honduras
17.8%
COGNITIVE DISABILITY
1.1/ 100
METRIC RATING
241st/ 347
METRIC RANK
18.0%
COGNITIVE DISABILITY
0.2/ 100
METRIC RATING
272nd/ 347
METRIC RANK
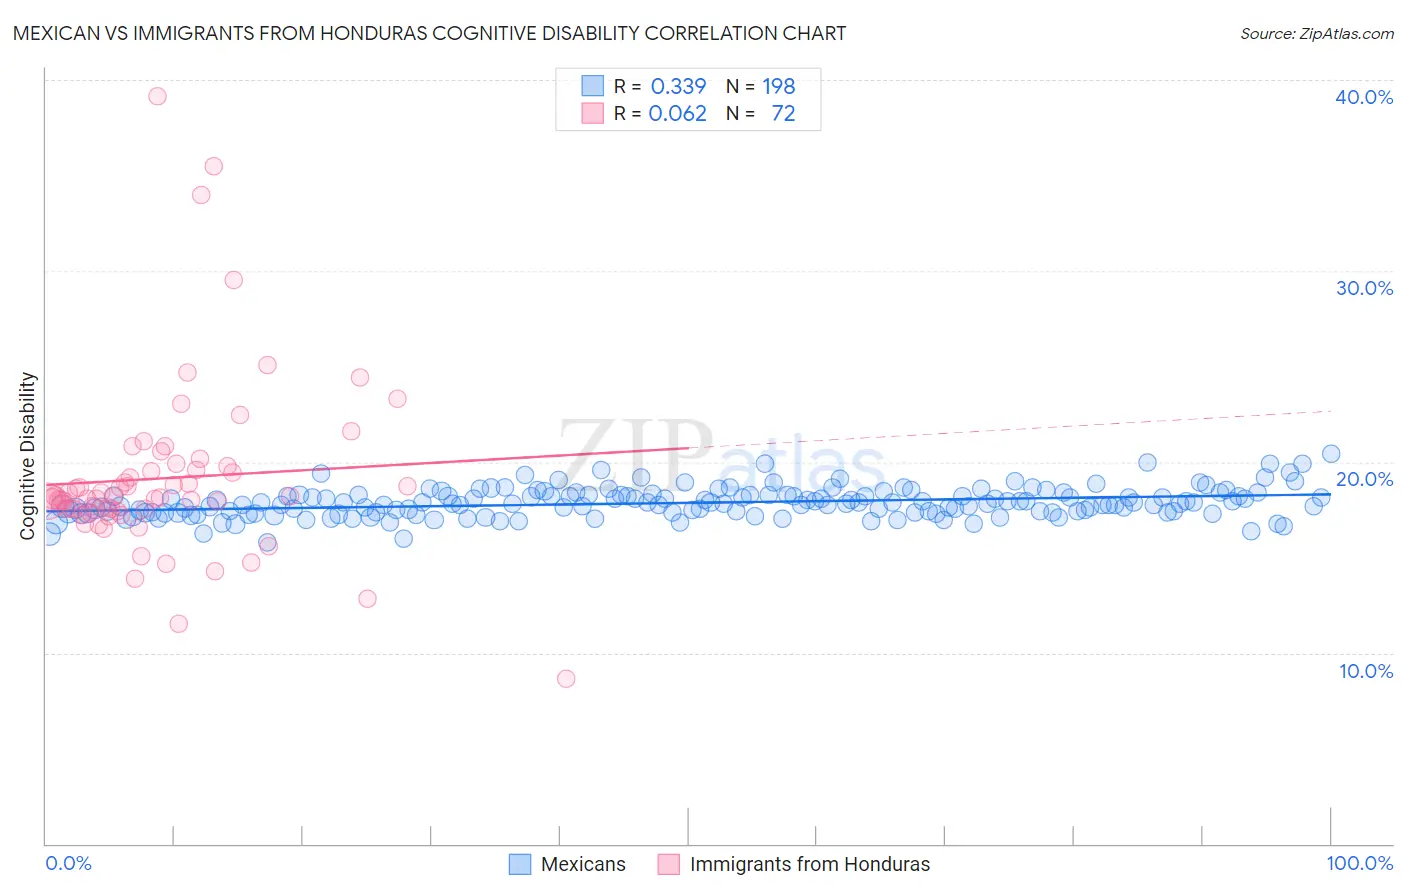
Mexican vs Immigrants from Honduras Cognitive Disability Correlation Chart
The statistical analysis conducted on geographies consisting of 565,048,688 people shows a mild positive correlation between the proportion of Mexicans and percentage of population with cognitive disability in the United States with a correlation coefficient (R) of 0.339 and weighted average of 17.8%. Similarly, the statistical analysis conducted on geographies consisting of 322,550,797 people shows a slight positive correlation between the proportion of Immigrants from Honduras and percentage of population with cognitive disability in the United States with a correlation coefficient (R) of 0.062 and weighted average of 18.0%, a difference of 1.1%.
Cognitive Disability Correlation Summary
| Measurement | Mexican | Immigrants from Honduras |
| Minimum | 15.8% | 8.7% |
| Maximum | 20.4% | 39.1% |
| Range | 4.6% | 30.5% |
| Mean | 17.9% | 19.1% |
| Median | 17.8% | 18.1% |
| Interquartile 25% (IQ1) | 17.3% | 17.5% |
| Interquartile 75% (IQ3) | 18.2% | 19.7% |
| Interquartile Range (IQR) | 0.90% | 2.2% |
| Standard Deviation (Sample) | 0.75% | 4.7% |
| Standard Deviation (Population) | 0.75% | 4.7% |
Similar Demographics by Cognitive Disability
Demographics Similar to Mexicans by Cognitive Disability
In terms of cognitive disability, the demographic groups most similar to Mexicans are Paiute (17.8%, a difference of 0.020%), Immigrants from Bangladesh (17.8%, a difference of 0.090%), Jamaican (17.9%, a difference of 0.13%), Iraqi (17.8%, a difference of 0.14%), and Cajun (17.8%, a difference of 0.18%).
| Demographics | Rating | Rank | Cognitive Disability |
| Osage | 2.0 /100 | #234 | Tragic 17.8% |
| Spanish American Indians | 2.0 /100 | #235 | Tragic 17.8% |
| Immigrants | Iraq | 1.8 /100 | #236 | Tragic 17.8% |
| Immigrants | Mexico | 1.8 /100 | #237 | Tragic 17.8% |
| Cheyenne | 1.7 /100 | #238 | Tragic 17.8% |
| Cajuns | 1.4 /100 | #239 | Tragic 17.8% |
| Iraqis | 1.4 /100 | #240 | Tragic 17.8% |
| Mexicans | 1.1 /100 | #241 | Tragic 17.8% |
| Paiute | 1.1 /100 | #242 | Tragic 17.8% |
| Immigrants | Bangladesh | 1.0 /100 | #243 | Tragic 17.8% |
| Jamaicans | 0.9 /100 | #244 | Tragic 17.9% |
| Trinidadians and Tobagonians | 0.8 /100 | #245 | Tragic 17.9% |
| Immigrants | Thailand | 0.8 /100 | #246 | Tragic 17.9% |
| Samoans | 0.7 /100 | #247 | Tragic 17.9% |
| French American Indians | 0.7 /100 | #248 | Tragic 17.9% |
Demographics Similar to Immigrants from Honduras by Cognitive Disability
In terms of cognitive disability, the demographic groups most similar to Immigrants from Honduras are Potawatomi (18.0%, a difference of 0.010%), Immigrants from Bahamas (18.0%, a difference of 0.090%), Honduran (18.0%, a difference of 0.10%), Immigrants from Nepal (18.0%, a difference of 0.12%), and Immigrants from Nigeria (18.0%, a difference of 0.13%).
| Demographics | Rating | Rank | Cognitive Disability |
| Spanish Americans | 0.4 /100 | #265 | Tragic 18.0% |
| Belizeans | 0.4 /100 | #266 | Tragic 18.0% |
| Nepalese | 0.3 /100 | #267 | Tragic 18.0% |
| Cherokee | 0.3 /100 | #268 | Tragic 18.0% |
| Hondurans | 0.3 /100 | #269 | Tragic 18.0% |
| Immigrants | Bahamas | 0.3 /100 | #270 | Tragic 18.0% |
| Potawatomi | 0.2 /100 | #271 | Tragic 18.0% |
| Immigrants | Honduras | 0.2 /100 | #272 | Tragic 18.0% |
| Immigrants | Nepal | 0.2 /100 | #273 | Tragic 18.0% |
| Immigrants | Nigeria | 0.2 /100 | #274 | Tragic 18.0% |
| Immigrants | Laos | 0.2 /100 | #275 | Tragic 18.1% |
| Yuman | 0.2 /100 | #276 | Tragic 18.1% |
| Immigrants | Kuwait | 0.2 /100 | #277 | Tragic 18.1% |
| Immigrants | Micronesia | 0.2 /100 | #278 | Tragic 18.1% |
| Chippewa | 0.1 /100 | #279 | Tragic 18.1% |