Mexican vs Immigrants from Austria Cognitive Disability
COMPARE
Mexican
Immigrants from Austria
Cognitive Disability
Cognitive Disability Comparison
Mexicans
Immigrants from Austria
17.8%
COGNITIVE DISABILITY
1.1/ 100
METRIC RATING
241st/ 347
METRIC RANK
16.3%
COGNITIVE DISABILITY
100.0/ 100
METRIC RATING
14th/ 347
METRIC RANK
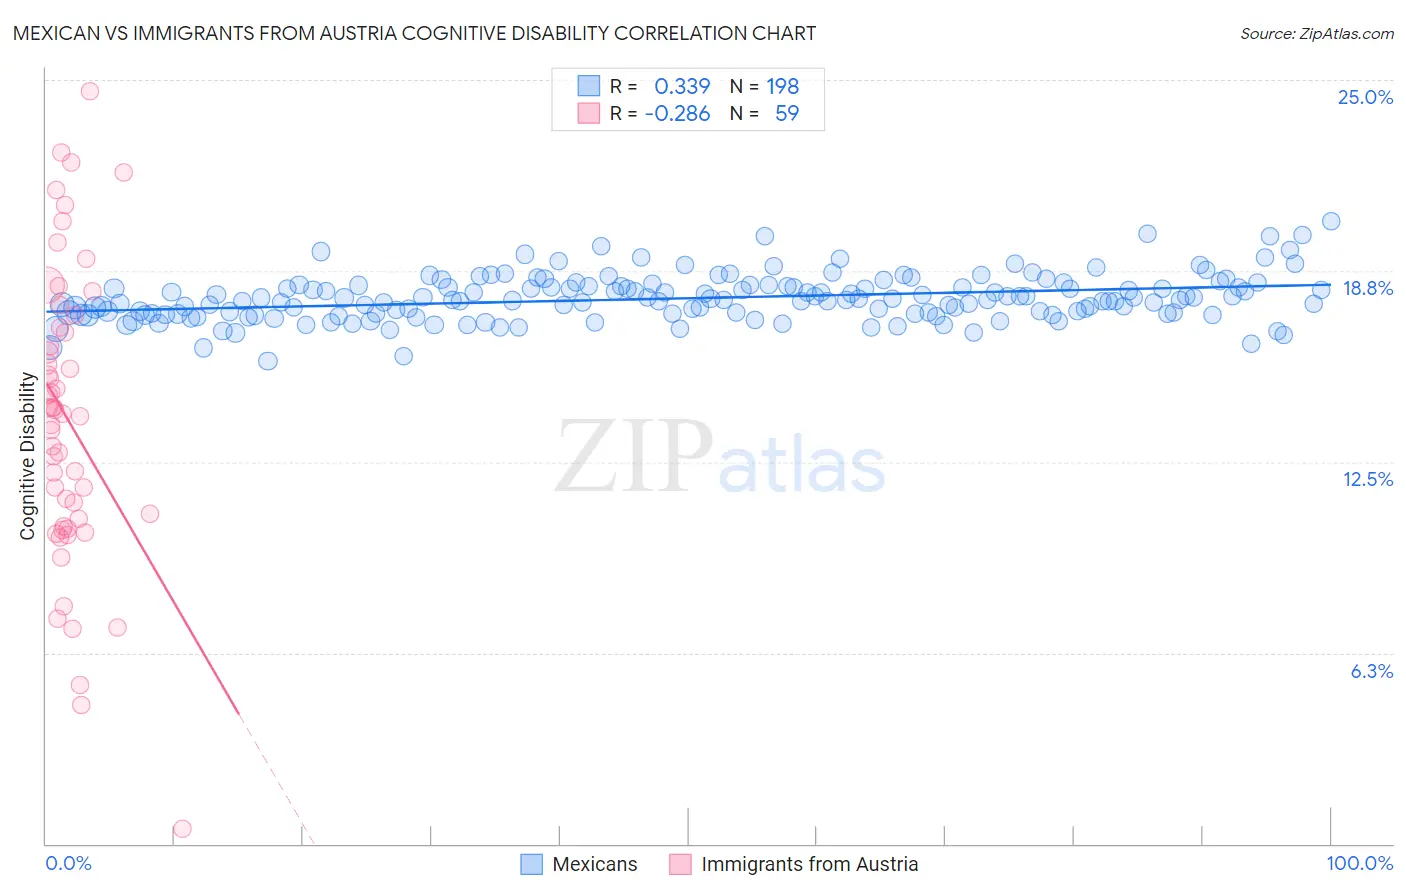
Mexican vs Immigrants from Austria Cognitive Disability Correlation Chart
The statistical analysis conducted on geographies consisting of 565,048,688 people shows a mild positive correlation between the proportion of Mexicans and percentage of population with cognitive disability in the United States with a correlation coefficient (R) of 0.339 and weighted average of 17.8%. Similarly, the statistical analysis conducted on geographies consisting of 167,969,615 people shows a weak negative correlation between the proportion of Immigrants from Austria and percentage of population with cognitive disability in the United States with a correlation coefficient (R) of -0.286 and weighted average of 16.3%, a difference of 9.6%.
Cognitive Disability Correlation Summary
| Measurement | Mexican | Immigrants from Austria |
| Minimum | 15.8% | 0.49% |
| Maximum | 20.4% | 24.6% |
| Range | 4.6% | 24.1% |
| Mean | 17.9% | 13.9% |
| Median | 17.8% | 14.1% |
| Interquartile 25% (IQ1) | 17.3% | 10.4% |
| Interquartile 75% (IQ3) | 18.2% | 16.9% |
| Interquartile Range (IQR) | 0.90% | 6.5% |
| Standard Deviation (Sample) | 0.75% | 4.8% |
| Standard Deviation (Population) | 0.75% | 4.8% |
Similar Demographics by Cognitive Disability
Demographics Similar to Mexicans by Cognitive Disability
In terms of cognitive disability, the demographic groups most similar to Mexicans are Paiute (17.8%, a difference of 0.020%), Immigrants from Bangladesh (17.8%, a difference of 0.090%), Jamaican (17.9%, a difference of 0.13%), Iraqi (17.8%, a difference of 0.14%), and Cajun (17.8%, a difference of 0.18%).
| Demographics | Rating | Rank | Cognitive Disability |
| Osage | 2.0 /100 | #234 | Tragic 17.8% |
| Spanish American Indians | 2.0 /100 | #235 | Tragic 17.8% |
| Immigrants | Iraq | 1.8 /100 | #236 | Tragic 17.8% |
| Immigrants | Mexico | 1.8 /100 | #237 | Tragic 17.8% |
| Cheyenne | 1.7 /100 | #238 | Tragic 17.8% |
| Cajuns | 1.4 /100 | #239 | Tragic 17.8% |
| Iraqis | 1.4 /100 | #240 | Tragic 17.8% |
| Mexicans | 1.1 /100 | #241 | Tragic 17.8% |
| Paiute | 1.1 /100 | #242 | Tragic 17.8% |
| Immigrants | Bangladesh | 1.0 /100 | #243 | Tragic 17.8% |
| Jamaicans | 0.9 /100 | #244 | Tragic 17.9% |
| Trinidadians and Tobagonians | 0.8 /100 | #245 | Tragic 17.9% |
| Immigrants | Thailand | 0.8 /100 | #246 | Tragic 17.9% |
| Samoans | 0.7 /100 | #247 | Tragic 17.9% |
| French American Indians | 0.7 /100 | #248 | Tragic 17.9% |
Demographics Similar to Immigrants from Austria by Cognitive Disability
In terms of cognitive disability, the demographic groups most similar to Immigrants from Austria are Immigrants from Greece (16.3%, a difference of 0.030%), Lithuanian (16.3%, a difference of 0.060%), Maltese (16.2%, a difference of 0.15%), Immigrants from Czechoslovakia (16.2%, a difference of 0.31%), and Eastern European (16.3%, a difference of 0.33%).
| Demographics | Rating | Rank | Cognitive Disability |
| Immigrants | Ireland | 100.0 /100 | #7 | Exceptional 16.1% |
| Immigrants | Poland | 100.0 /100 | #8 | Exceptional 16.1% |
| Assyrians/Chaldeans/Syriacs | 100.0 /100 | #9 | Exceptional 16.2% |
| Immigrants | Scotland | 100.0 /100 | #10 | Exceptional 16.2% |
| Immigrants | Czechoslovakia | 100.0 /100 | #11 | Exceptional 16.2% |
| Maltese | 100.0 /100 | #12 | Exceptional 16.2% |
| Lithuanians | 100.0 /100 | #13 | Exceptional 16.3% |
| Immigrants | Austria | 100.0 /100 | #14 | Exceptional 16.3% |
| Immigrants | Greece | 100.0 /100 | #15 | Exceptional 16.3% |
| Eastern Europeans | 100.0 /100 | #16 | Exceptional 16.3% |
| Immigrants | North Macedonia | 100.0 /100 | #17 | Exceptional 16.3% |
| Immigrants | Northern Europe | 100.0 /100 | #18 | Exceptional 16.3% |
| Immigrants | Bolivia | 100.0 /100 | #19 | Exceptional 16.3% |
| Bulgarians | 100.0 /100 | #20 | Exceptional 16.3% |
| Immigrants | Cuba | 100.0 /100 | #21 | Exceptional 16.3% |