Mexican American Indian vs Ottawa Female Disability
COMPARE
Mexican American Indian
Ottawa
Female Disability
Female Disability Comparison
Mexican American Indians
Ottawa
12.3%
FEMALE DISABILITY
24.9/ 100
METRIC RATING
198th/ 347
METRIC RANK
14.2%
FEMALE DISABILITY
0.0/ 100
METRIC RATING
327th/ 347
METRIC RANK
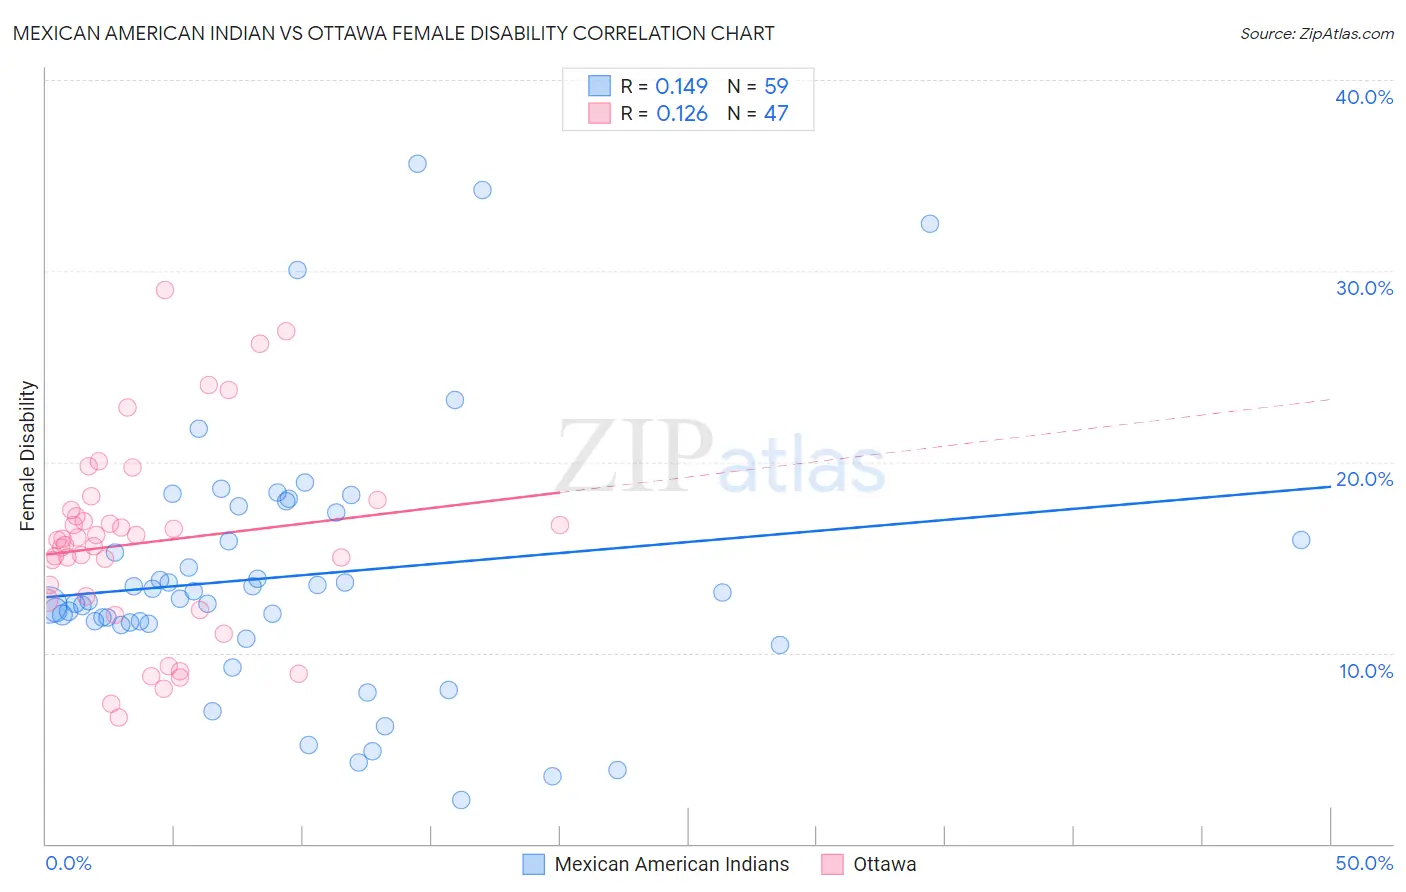
Mexican American Indian vs Ottawa Female Disability Correlation Chart
The statistical analysis conducted on geographies consisting of 317,566,879 people shows a poor positive correlation between the proportion of Mexican American Indians and percentage of females with a disability in the United States with a correlation coefficient (R) of 0.149 and weighted average of 12.3%. Similarly, the statistical analysis conducted on geographies consisting of 49,954,639 people shows a poor positive correlation between the proportion of Ottawa and percentage of females with a disability in the United States with a correlation coefficient (R) of 0.126 and weighted average of 14.2%, a difference of 15.6%.
Female Disability Correlation Summary
| Measurement | Mexican American Indian | Ottawa |
| Minimum | 2.3% | 6.6% |
| Maximum | 35.6% | 29.0% |
| Range | 33.3% | 22.4% |
| Mean | 14.0% | 15.8% |
| Median | 12.8% | 15.9% |
| Interquartile 25% (IQ1) | 11.5% | 12.8% |
| Interquartile 75% (IQ3) | 17.3% | 17.5% |
| Interquartile Range (IQR) | 5.8% | 4.7% |
| Standard Deviation (Sample) | 6.8% | 5.1% |
| Standard Deviation (Population) | 6.8% | 5.0% |
Similar Demographics by Female Disability
Demographics Similar to Mexican American Indians by Female Disability
In terms of female disability, the demographic groups most similar to Mexican American Indians are Immigrants from Trinidad and Tobago (12.3%, a difference of 0.010%), Immigrants from Panama (12.3%, a difference of 0.030%), Honduran (12.3%, a difference of 0.030%), Swedish (12.3%, a difference of 0.080%), and Ukrainian (12.3%, a difference of 0.11%).
| Demographics | Rating | Rank | Female Disability |
| Armenians | 29.7 /100 | #191 | Fair 12.3% |
| Immigrants | Western Africa | 29.2 /100 | #192 | Fair 12.3% |
| Northern Europeans | 27.5 /100 | #193 | Fair 12.3% |
| Ukrainians | 27.2 /100 | #194 | Fair 12.3% |
| Swedes | 26.6 /100 | #195 | Fair 12.3% |
| Immigrants | Panama | 25.5 /100 | #196 | Fair 12.3% |
| Hondurans | 25.4 /100 | #197 | Fair 12.3% |
| Mexican American Indians | 24.9 /100 | #198 | Fair 12.3% |
| Immigrants | Trinidad and Tobago | 24.7 /100 | #199 | Fair 12.3% |
| Trinidadians and Tobagonians | 22.4 /100 | #200 | Fair 12.3% |
| Chinese | 22.1 /100 | #201 | Fair 12.3% |
| Somalis | 21.5 /100 | #202 | Fair 12.3% |
| Immigrants | Barbados | 21.1 /100 | #203 | Fair 12.3% |
| Immigrants | Zaire | 20.9 /100 | #204 | Fair 12.3% |
| Immigrants | Grenada | 20.5 /100 | #205 | Fair 12.4% |
Demographics Similar to Ottawa by Female Disability
In terms of female disability, the demographic groups most similar to Ottawa are Cape Verdean (14.2%, a difference of 0.0%), Osage (14.3%, a difference of 0.43%), Comanche (14.2%, a difference of 0.44%), Navajo (14.2%, a difference of 0.55%), and Native/Alaskan (14.1%, a difference of 0.69%).
| Demographics | Rating | Rank | Female Disability |
| Americans | 0.0 /100 | #320 | Tragic 14.1% |
| Potawatomi | 0.0 /100 | #321 | Tragic 14.1% |
| Pueblo | 0.0 /100 | #322 | Tragic 14.1% |
| Blacks/African Americans | 0.0 /100 | #323 | Tragic 14.1% |
| Natives/Alaskans | 0.0 /100 | #324 | Tragic 14.1% |
| Navajo | 0.0 /100 | #325 | Tragic 14.2% |
| Comanche | 0.0 /100 | #326 | Tragic 14.2% |
| Ottawa | 0.0 /100 | #327 | Tragic 14.2% |
| Cape Verdeans | 0.0 /100 | #328 | Tragic 14.2% |
| Osage | 0.0 /100 | #329 | Tragic 14.3% |
| Yuman | 0.0 /100 | #330 | Tragic 14.5% |
| Immigrants | Cabo Verde | 0.0 /100 | #331 | Tragic 14.6% |
| Pima | 0.0 /100 | #332 | Tragic 14.8% |
| Immigrants | Azores | 0.0 /100 | #333 | Tragic 14.9% |
| Cherokee | 0.0 /100 | #334 | Tragic 14.9% |