Mexican American Indian vs German Russian Female Disability
COMPARE
Mexican American Indian
German Russian
Female Disability
Female Disability Comparison
Mexican American Indians
German Russians
12.3%
FEMALE DISABILITY
24.9/ 100
METRIC RATING
198th/ 347
METRIC RANK
12.6%
FEMALE DISABILITY
3.2/ 100
METRIC RATING
240th/ 347
METRIC RANK
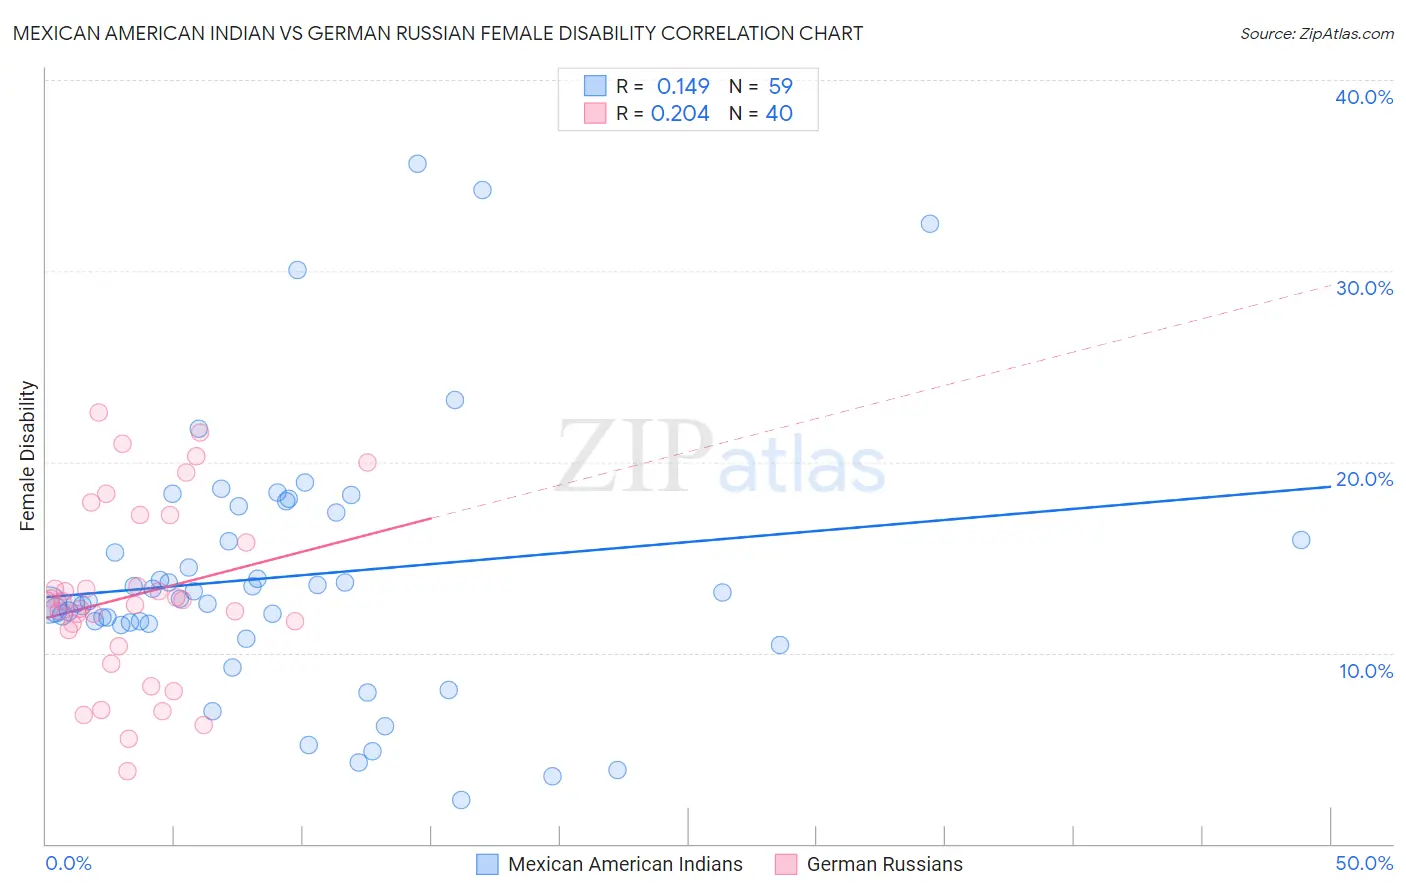
Mexican American Indian vs German Russian Female Disability Correlation Chart
The statistical analysis conducted on geographies consisting of 317,566,879 people shows a poor positive correlation between the proportion of Mexican American Indians and percentage of females with a disability in the United States with a correlation coefficient (R) of 0.149 and weighted average of 12.3%. Similarly, the statistical analysis conducted on geographies consisting of 96,458,530 people shows a weak positive correlation between the proportion of German Russians and percentage of females with a disability in the United States with a correlation coefficient (R) of 0.204 and weighted average of 12.6%, a difference of 2.1%.
Female Disability Correlation Summary
| Measurement | Mexican American Indian | German Russian |
| Minimum | 2.3% | 3.8% |
| Maximum | 35.6% | 22.6% |
| Range | 33.3% | 18.8% |
| Mean | 14.0% | 13.0% |
| Median | 12.8% | 12.6% |
| Interquartile 25% (IQ1) | 11.5% | 10.8% |
| Interquartile 75% (IQ3) | 17.3% | 16.5% |
| Interquartile Range (IQR) | 5.8% | 5.7% |
| Standard Deviation (Sample) | 6.8% | 4.7% |
| Standard Deviation (Population) | 6.8% | 4.6% |
Similar Demographics by Female Disability
Demographics Similar to Mexican American Indians by Female Disability
In terms of female disability, the demographic groups most similar to Mexican American Indians are Immigrants from Trinidad and Tobago (12.3%, a difference of 0.010%), Immigrants from Panama (12.3%, a difference of 0.030%), Honduran (12.3%, a difference of 0.030%), Swedish (12.3%, a difference of 0.080%), and Ukrainian (12.3%, a difference of 0.11%).
| Demographics | Rating | Rank | Female Disability |
| Armenians | 29.7 /100 | #191 | Fair 12.3% |
| Immigrants | Western Africa | 29.2 /100 | #192 | Fair 12.3% |
| Northern Europeans | 27.5 /100 | #193 | Fair 12.3% |
| Ukrainians | 27.2 /100 | #194 | Fair 12.3% |
| Swedes | 26.6 /100 | #195 | Fair 12.3% |
| Immigrants | Panama | 25.5 /100 | #196 | Fair 12.3% |
| Hondurans | 25.4 /100 | #197 | Fair 12.3% |
| Mexican American Indians | 24.9 /100 | #198 | Fair 12.3% |
| Immigrants | Trinidad and Tobago | 24.7 /100 | #199 | Fair 12.3% |
| Trinidadians and Tobagonians | 22.4 /100 | #200 | Fair 12.3% |
| Chinese | 22.1 /100 | #201 | Fair 12.3% |
| Somalis | 21.5 /100 | #202 | Fair 12.3% |
| Immigrants | Barbados | 21.1 /100 | #203 | Fair 12.3% |
| Immigrants | Zaire | 20.9 /100 | #204 | Fair 12.3% |
| Immigrants | Grenada | 20.5 /100 | #205 | Fair 12.4% |
Demographics Similar to German Russians by Female Disability
In terms of female disability, the demographic groups most similar to German Russians are Barbadian (12.6%, a difference of 0.090%), Yugoslavian (12.6%, a difference of 0.13%), Slavic (12.6%, a difference of 0.15%), Japanese (12.6%, a difference of 0.17%), and Canadian (12.6%, a difference of 0.22%).
| Demographics | Rating | Rank | Female Disability |
| Immigrants | Iraq | 5.3 /100 | #233 | Tragic 12.5% |
| Scandinavians | 5.3 /100 | #234 | Tragic 12.5% |
| Malaysians | 5.0 /100 | #235 | Tragic 12.5% |
| Immigrants | West Indies | 4.4 /100 | #236 | Tragic 12.6% |
| Slavs | 3.8 /100 | #237 | Tragic 12.6% |
| Yugoslavians | 3.7 /100 | #238 | Tragic 12.6% |
| Barbadians | 3.6 /100 | #239 | Tragic 12.6% |
| German Russians | 3.2 /100 | #240 | Tragic 12.6% |
| Japanese | 2.7 /100 | #241 | Tragic 12.6% |
| Canadians | 2.6 /100 | #242 | Tragic 12.6% |
| Immigrants | Senegal | 2.5 /100 | #243 | Tragic 12.6% |
| Alsatians | 2.5 /100 | #244 | Tragic 12.6% |
| Immigrants | Jamaica | 2.2 /100 | #245 | Tragic 12.6% |
| Spanish American Indians | 2.1 /100 | #246 | Tragic 12.6% |
| Menominee | 2.1 /100 | #247 | Tragic 12.6% |